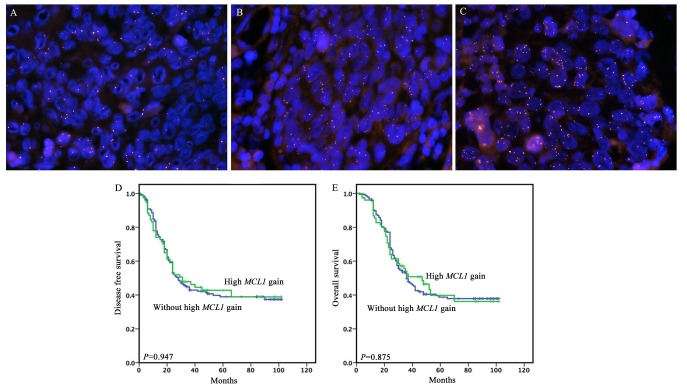
Figure 1. Representative fluorescence in situ hybridization (FISH) signal patterns of select MCL1 anomalies and the prognostic significance of high MCL1 gain in full cohort.
(A) Normal or loss of MCL1, (B) low MCL1 gain (2.5 to 5 average MCL1 copies/nucleus), (C) High MCL1 gain (>5.0 average MCL1 gene copies/nucleus), (D and E) High MCL1 gain for DFS and OS.

