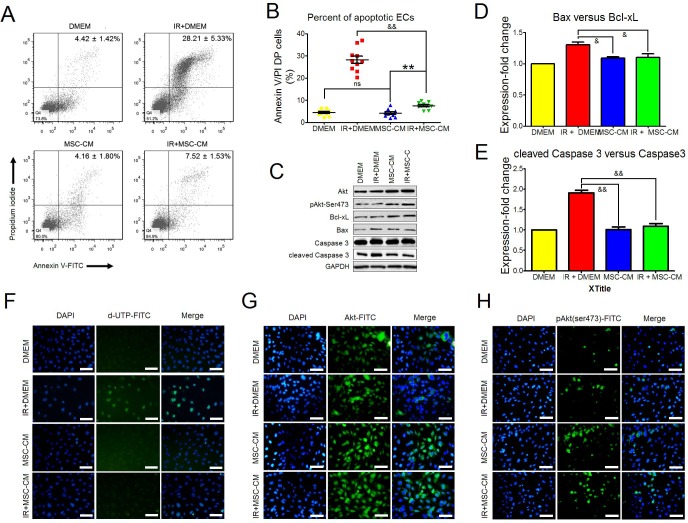
Figure 3. The anti-apoptotic effect of MSC-CM.
(A) Flow-cytometric analysis of HUVEC apoptosis using annexin V plus propidium iodide staining. Late apoptotic cells were defined as double-positive for annexin V and propidium iodide. Statistical values in the upper-right quadrant are shown as the Mean ± S.D. of each group. Each group contained 10 samples (n = 10). (B) Statistical analysis for comparing the ratios of late apoptotic HUVEC between groups using the unpaired t test method. Data are shown as the mean ± S.D of 10 independent measurements (n = 10). &&P ≤ 0.001: Significantly low (IR+MSC-CM versus IR+DMEM group); ns: No significance (DMEM group versus MSC-CM group); **P ≤ 0.001: Significant high (IR+MSC-CM group versus MSC-CM group). (C) Inhibitory effect of MSC-CM on cell apoptosis. Intact or irradiated HUVEC were separately treated using DMEM or MSC-CM for 2 hours. Total Akt, phosphorylated Akt Ser473, Bcl-xL, Bax, caspase 3 and cleaved caspase 3 were tested using Western blot analysis. GAPDH was used as an internal control. Similar results were observed when carrying out independent test (n = 3). (D) Ratio of Bax versus Bcl-xL. Gray densities of Bcl-xL and Bax were calculated using Image-Pro Plus 6.0 Software. Then, the value of Bax gray density versus Bcl-xL gray density in each group was computed. The ratio of Bax versus Bcl-xL in the DMEM group was set as 1. Ratios in the other groups were normalized to the DMEM group. Three independent measurements were carried out (n = 3). Data are shown as the Mean±S.D. Unpaired t test method was used for analyzing statistical differences between groups. &P ≤ 0.05: Significantly lower than IR+DMEM group. (E) Ratio of cleaved caspase 3 versus caspase 3. Gray densities of cleaved caspase 3 and caspase 3 were calculated using Image-Pro Plus 6.0 Software. Then, the value of cleaved caspase 3 gray density versus caspase 3 gray density in each group was computed. The ratio of cleaved caspase 3 versus caspase 3 in the DMEM group was set as 1. Ratios in the other groups were normalized to the DMEM group. Three independent measurements were carried out (n = 3). Data are shown as the Mean±S.D. Unpaired t test method was used for analyzing statistical differences between groups. &P ≤ 0.05: Significantly lower than IR+DMEM group. (F) In situ apoptosis of HUVEC. Intact or irradiated HUVEC were seeded onto 6-well plates. After treating with DMEM or MSC-CM for 2 hours, TUNEL assay for in situ apoptosis was performed. DAPI: Nuclei staining. Magnification at 200×; Scale bar: 100 μm. Similar results were observed when carrying out independent test (n = 3). (G) Total Akt in HUVEC. Intact or irradiated HUVEC were seeded onto 6-well plates. After treating with DMEM or MSC-CM for 2 hours, ICC-staining for total Akt was performed. DAPI: Nuclei staining. Magnification at 200×; Scale bar: 100 μm. Similar results were observed when carrying out independent test (n = 3). (H) Phosphorylated Akt Ser473 in HUVEC. Intact or irradiated HUVEC were seeded onto6-well plates. After treating with DMEM or MSC-CM for 2 hours, ICC-staining for total Akt was performed. DAPI: Nuclei staining. Magnification at 200×; Scale bar: 100 μm. Similar results were observed when carrying out independent test (n = 3).

