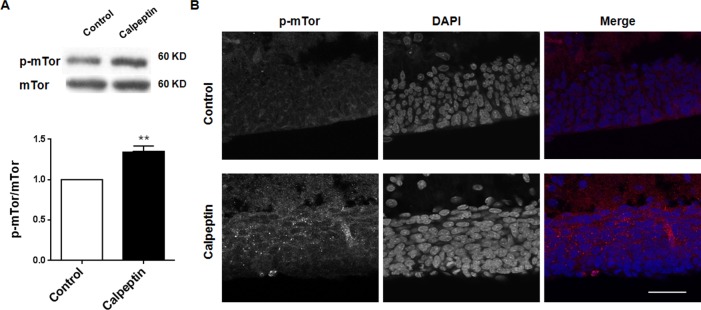
Figure 3. Postnatal application of calpeptin promotes mammalian target of rapamycin (mTor) phosphorylation.
(A) Upper panel shows representative blots of p-mTor in cerebellum. Lower panel shows summary data of p-mTor expression after application of calpain inhibitor. Results represent means ± SEM, n = 5. **p < 0.01 compared with control group (Paired t test). (B) Representative images of p-mTor expression in cerebellum after injection of calpain inhibitor. Scale bar: 50 μm.

