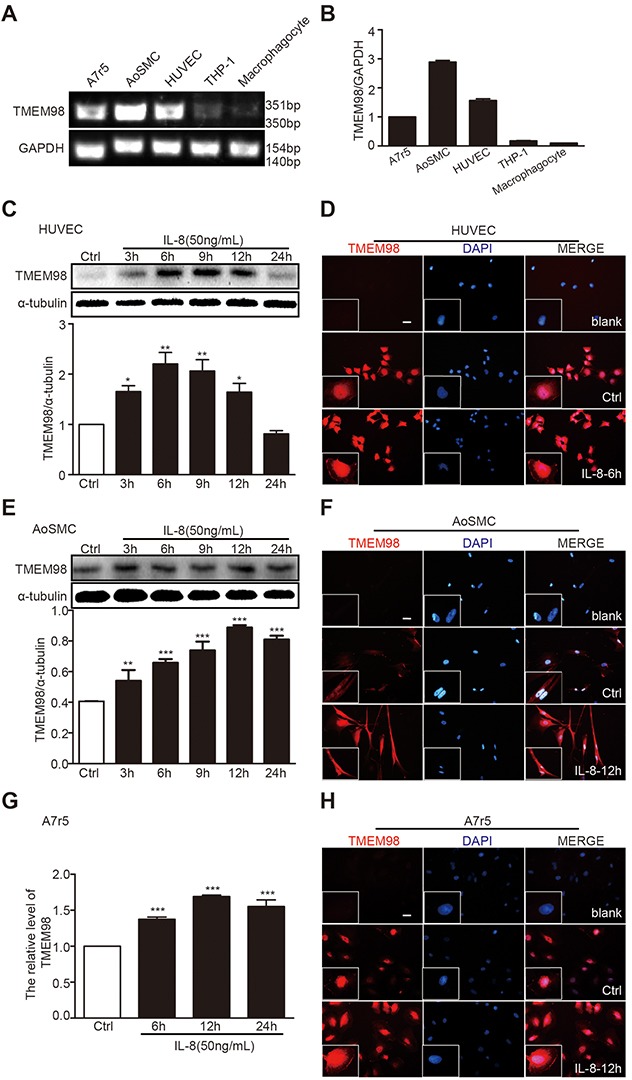
Figure 2. The expression of TMEM98 after treatment with IL-8 in HUVEC, AoSMC and A7r5.

RT-PCR was performed to demonstrate TMEM98 expression in various cell lines (A) The graphic showed the statistical data of Figure 2A (B) HUVEC (C and D), AoSMC (E and F), and A7r5 cells (G and H) were treated with IL-8 at the indicated time lines (C-H). The cell lysates were analyzed by Western blotting using anti-TMEM98 antibody (C and E). mRNA level of TMEM98 was analyzed by real time RT-PCR (G) Immunofluorescence staining confirmed the level and location of TMEM98 (D, F and H). The results were quantified and plotted in the bar graph and were expressed as the means ± SD (n=3). *p<0.05, **p<0.01, ***p<0.001 compared with the control group. Bars=100μm.
