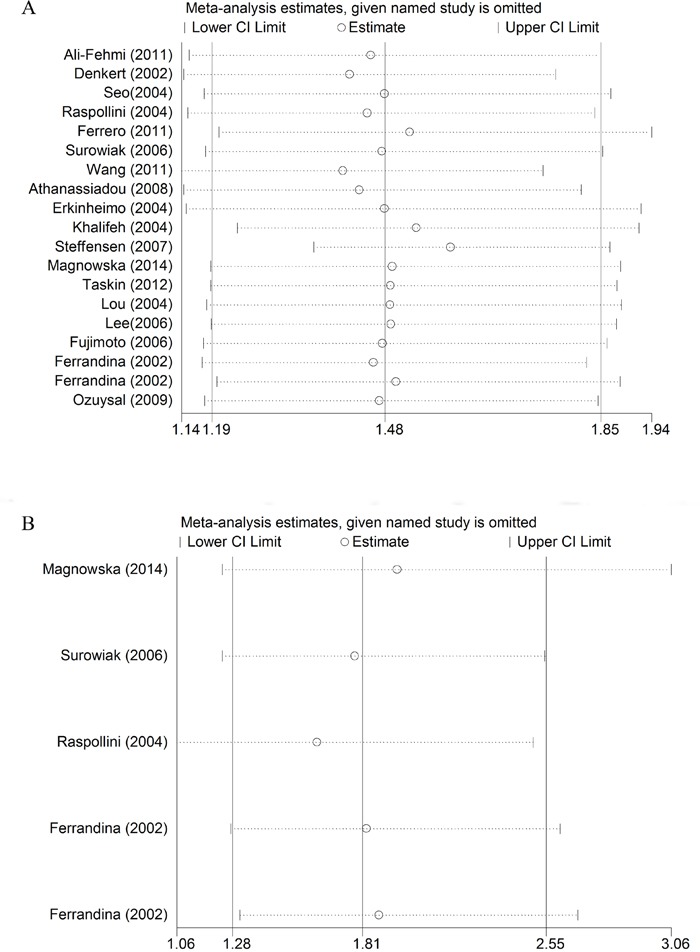
Figure 4.

Sensitive analysis of the pooled hazard ratio for OS (A) and DFS (B). Meta-analysis random effects estimates were used. Results were computed by omitting each study (on the left) in turn. The two ends of every broken line represented the 95% confidence interval.
