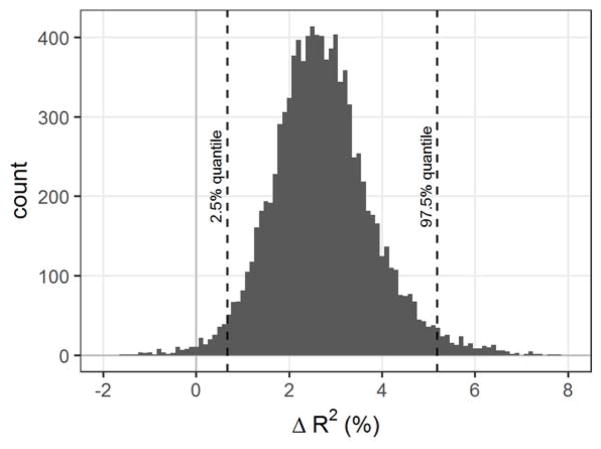
Figure 2.
Sampling distribution of difference in R2 value (shown as change in % variance explained) between hierarchical regressions with bioaccessible Pb and total Pb in soil as alternate predictors. A positive difference represents better performance by the model using bioaccessible Pb in soil. Dotted lines show the 2.5% and 97.5% quantiles that define the 95% confidence interval.

