
Figure 6.
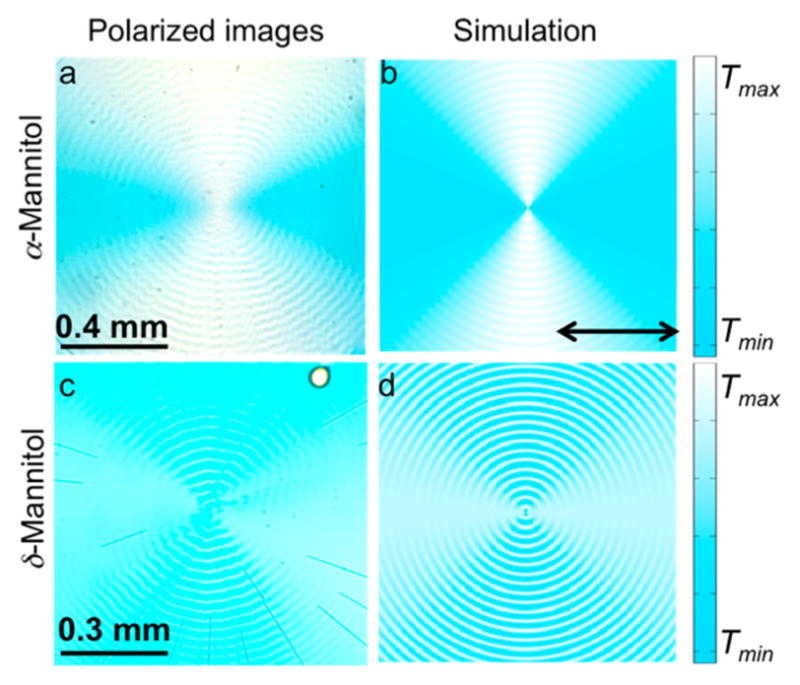
Images in horizontal linearly polarized light of (a) banded α-mannitol spherulites and (c) banded δ-mannitol spherulites containing 0.5 wt% CSB, 15 wt% PVP grown at 100 °C and the simulated transmission images with dyes oriented at (b) Φdye = ±10° and Θdye = ±80° and (d) Φdye = ±70° and Θdye = ±20°. T = normalized transmittance. The color in the simulations was chosen to match what is observed by the eye.