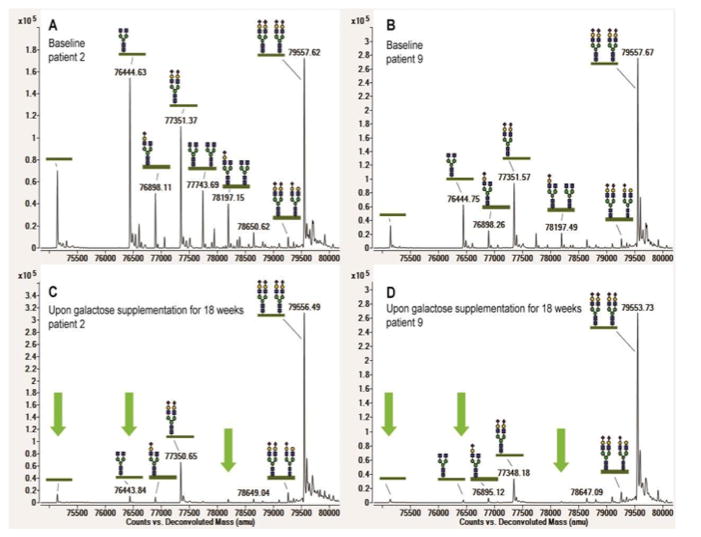
Figure 2.
High-resolution mass spectrometry of intact serum transferrin. Baseline profiles of patient 2 (a) and patient 9 (b) show characteristic PGM1 glycoforms with truncated glycans and lack of whole glycans. Patient 9 shows a milder profile than patient 2; Spectra of patient 2 (c) and patient 9 (d) show large improvement through the reduction of abnormal glycosylation peaks upon 18 weeks of galactose treatment, as is highlighted by the green arrows.

