
Figure 3.
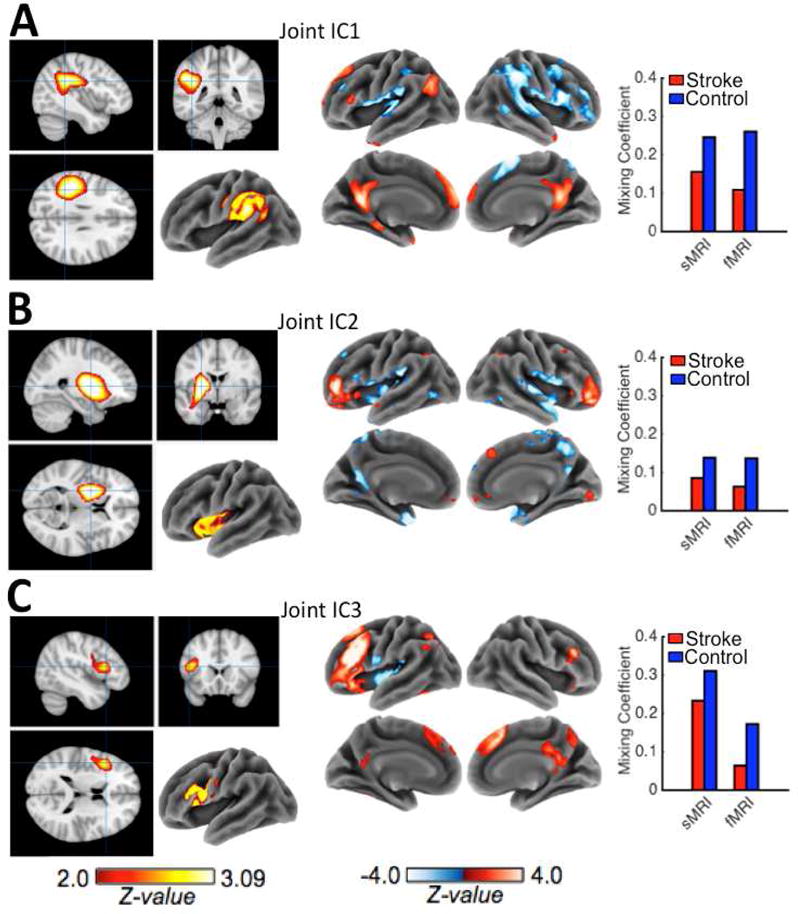
A–C. Z-scaled (|Z| > 2.0) back-reconstructed maps for the sMRI (left) and fMRI (right) components of each group-differentiating joint IC are shown along with bar graphs of the mean sMRI and fMRI mixing coefficients (loadings) from stroke patients (red) and controls (blue) on each group-differentiating joint IC. Patient loadings were significantly (FWEp<0.05) lower than control loadings for all 3 group-differentiating joint ICs, indicating that these components were less represented in the patient data than in the control data.