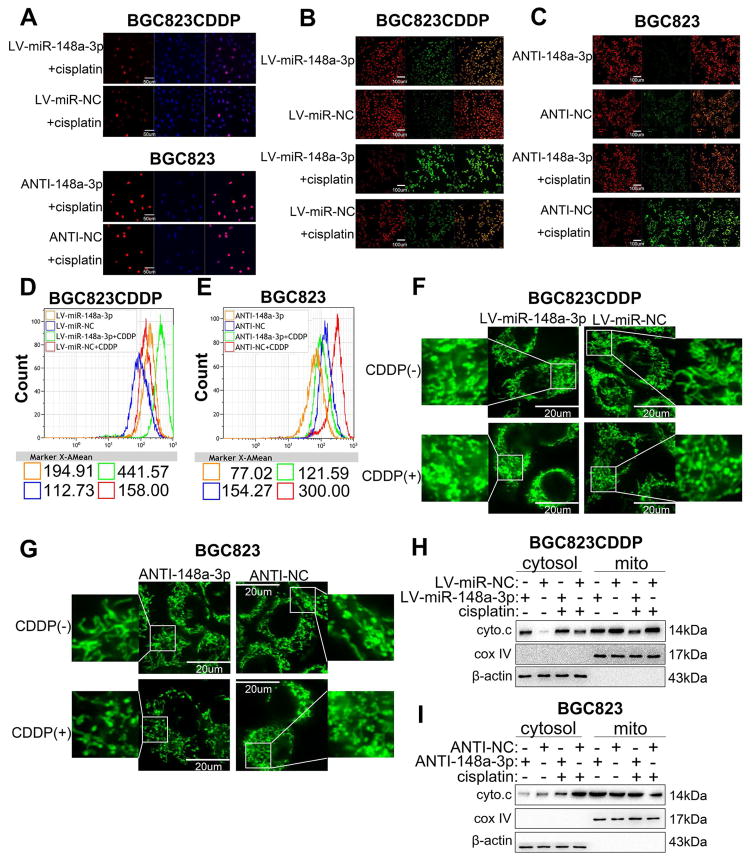
Figure 3. miR-148a-3p increased CDDP-induced cell death through promoting mitochondrial fission-mediated apoptosis.
(A) Immunofluorescence staining of phosphorylated H2AX (yH2AX) using confocal microscopy in BGC823CDDP and BGC823 cells treated with CDDP (48h). Scale bar = 50 μm. (B, C) Mitochondrial membrane potential was detected in BGC823CDDP and BGC823 cells by immunofluorescence JC-1 staining. Scale bar = 100 μm. (D, E) Cellular ROS levels were measured by DCFH-DA staining in cells with CDDP 48h treatment. (F, G) BGC823CDDP and BGC823 cells transfected with Mito-Tracker Green probe. Mitochondrial morphology in individual cells was dyed green color by the probe, and identified by confocal microscopy. Fragmented mitochondria were shortened, punctate, and sometimes rounded, whereas filamentous mitochondria showed a thread-like tubular structure. Quantitation of mitochondria were evaluated as mentioned in Materials and Methods. Mitochondrial morphology was observed in BGC823CDDP and BGC823 cells using Mito-Tracker Green staining after CDDP or PBS exposure for 48 h. Scale bar = 20 μm. Mitochondrial fission positive cell percentages were calculated, as mentioned in Supplementary Fig. S4G–H. (H, I) Western blot analysis of cytochrome C (cyto.c) protein levels in cytosol or mitochondrial (mito) of BGC823CDDP (with or without miR-148a-3p reconstitution) and BGC823 cells (with or without miR-148a-3p inhibition) with or without 48h CDDP treatment. β-actin: internal control in cytosol. Cox IV: internal control in mitochondrial fragments. CDDP concentrations: same as in Figure 2. Graph represents mean ± SEM; *P<0.05, **P<0.01, ***P<0.001.

