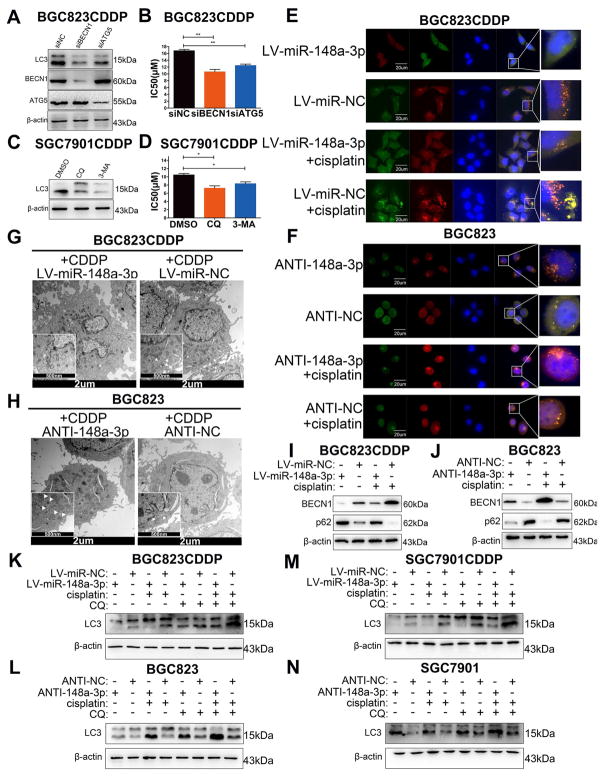
Figure 4. miR-148a-3p enhanced CDDP cytotoxicity by inhibiting cyto-protective autophagy.
(A) Western blot analysis of LC3-II, BECN1, and ATG5 protein levels in cells with BECN1 or ATG5 siRNA knockdown (C) or with CQ or 3-MA treatment. (B, D) CDDP IC50s of cells in Panel A&C. (E, F) Immunofluorescence analysis using GFP-mRFP-LC3 staining. Scale bar = 20 μm. The numbers of LC3 puncta (yellow puncta for autophagosome, red puncta for autolysosome) were quantified in Supplementary Fig. S5C–F. (G, H) Transmission Electron Microscope images of endogenic autophagic microstructure in BGC823CDDP and BGC823 cells. The white arrows refer to cellular autophagosome or autolysosome that has a double layer structure. Scale bar = 2 μm or 500 nm. (I, J) Western blot analysis of BECN1 and p62 protein levels in cells with or without CDDP treatment. (K–N) LC3-II protein levels were detected in cells with CDDP (48h) and/or CQ (1h) treatment. CQ, Chloroquine. DMSO, Dimethyl Sulfoxide. 3-MA, 3-Methyladenine. β-actin: internal control. CDDP concentrations: same as in Figure 2. Graph represents mean ± SEM; * = P<0.05, ** = P<0.01, *** = P<0.001.

