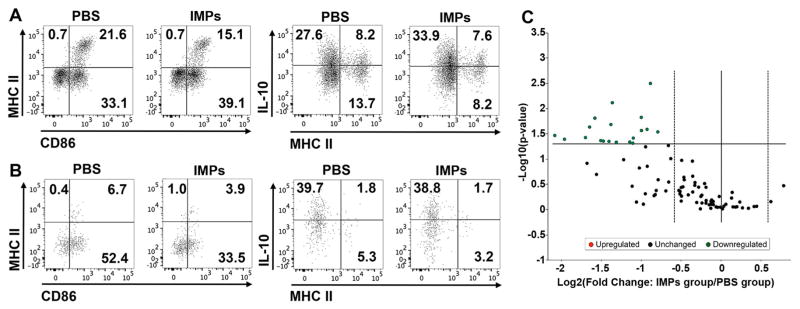
Fig. 2.
IMPs treatment reduces M1 macrophage and microglia activation in the lesions of SCI mice. Mice received IMPs or vehicle 2 h and 24 h after a SCI and were sacrificed at 48 h to (A) analyze the macrophage profile of infiltrating cells, (B) evaluate the microglia profile and (C) quantify the chemokines and cytokines in the injured part of the CNS. (A and B) Macrophages (CD45hi CD11b+ Ly6G− CD11c−) show a reduced M1 profile (MHCII+ CD86+) along with increased IL-10 expression in mice treated with IMPs. In the same mice, microglia (CD45int CD11b+ LyClo) had reduced expression of the costimulatory molecule CD86. Data shown are representative of n = 2 independent experiments with 5–6 mice pooled for each experiment. (C) Volcano plot for differential gene expression showing statistical significance vs. fold change. Each point represents the results of one gene in which the x-axis is the log 2 fold change for the ratio IMPs treated mice vs PBS treated mice, whereas the y-axis is the −Log10 of p-value. Vertical dash lines represent differential expression differences of ±1.5 fold and statistically significant genes are observed above the horizontal line, which corresponds to a p-value of 0.05 (Student’s t-test, n = 5 mice per group). A complete list of genes and p values are provided in the Supporting material (Supplementary Table 2).

