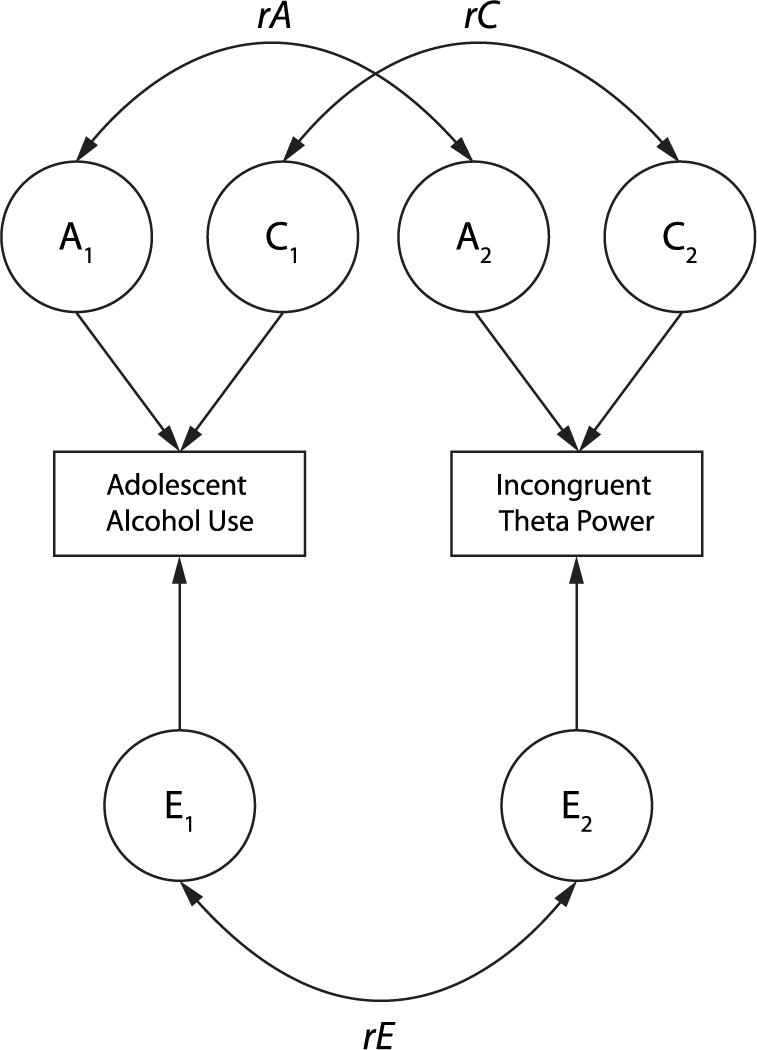
Figure 2.

Graphical depiction of a general ACE bivariate model illustrating the variance in each individual observed phenotype (indicated in rectangular boxes) parsed into that explained by latent variables (indicated in circles) reflecting additive genetic (A), shared environmental (C), and nonshared environmental (E) effects, and the associated genetic (rA), shared environmental (rC), and nonshared environmental (rE) correlations, between adolescent alcohol use and incongruent theta-band power. The rE correlation is analogous to the within-pair exposure effect in the cotwin control analysis, while rA and rC capture the familial risk effect.
