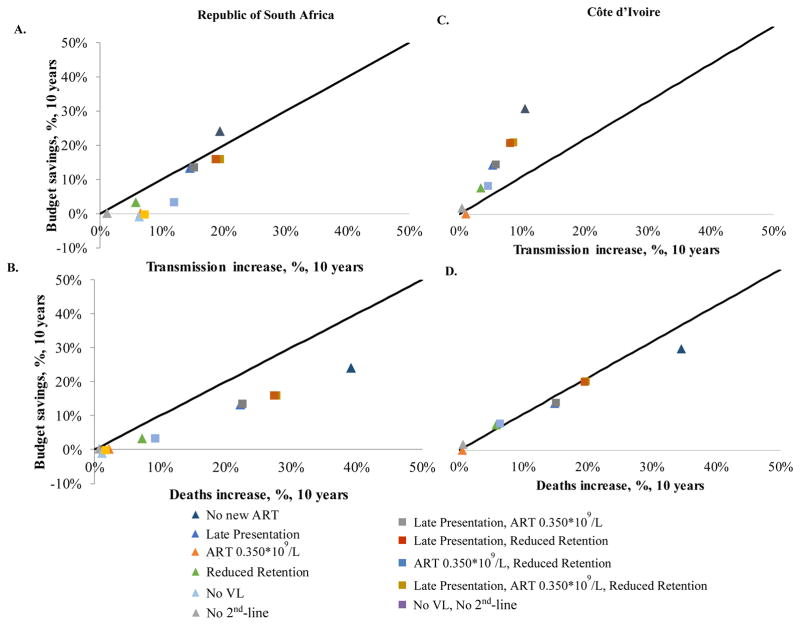
Figure 2. Comparison of proportional transmission increases and death increases versus proportional budget reductions for HIV scale-back strategies in the Republic of South Africa (A and B) and Côte d’Ivoire (C and D).
The figure compares the percent increase in adverse events against the percent decrease in financial outlays for each scale-back strategy, relative to the Current Standard. The vertical axis of each panel denotes the magnitude of the budgetary savings that can be achieved; the horizontal axis denotes the concomitant proportional increase in transmissions (panels A and C) and deaths (panels B and D). The solid black line with slope equal to 1 represents the “line of identity”; this denotes instances where the percent increase in adverse events equals the percent decrease in financial outlays. Different scale-back strategies are denoted by different colored points. Programs represented by triangles (single programmatic cuts) and squares (combination programmatic cuts) that lie above the line of identity indicate scale-back strategies that deliver greater proportional budgetary savings than the offsetting proportional increase they produce in transmissions or deaths. The figure reports the proportional increase in undiscounted adverse events produced by a given proportional reduction in the budget (undiscounted). It does not represent an assessment of economic value or incremental cost-effectiveness. Because of differences in the ratio of labor compared to ART costs between the two countries, most interventions in CI save proportionally more money, exceeding the line of identity for transmissions and approaching it for deaths.

