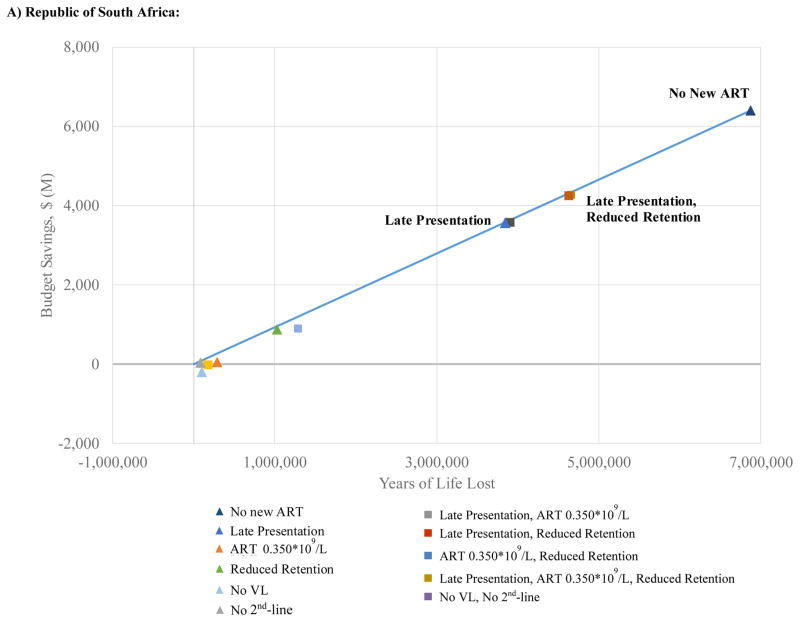
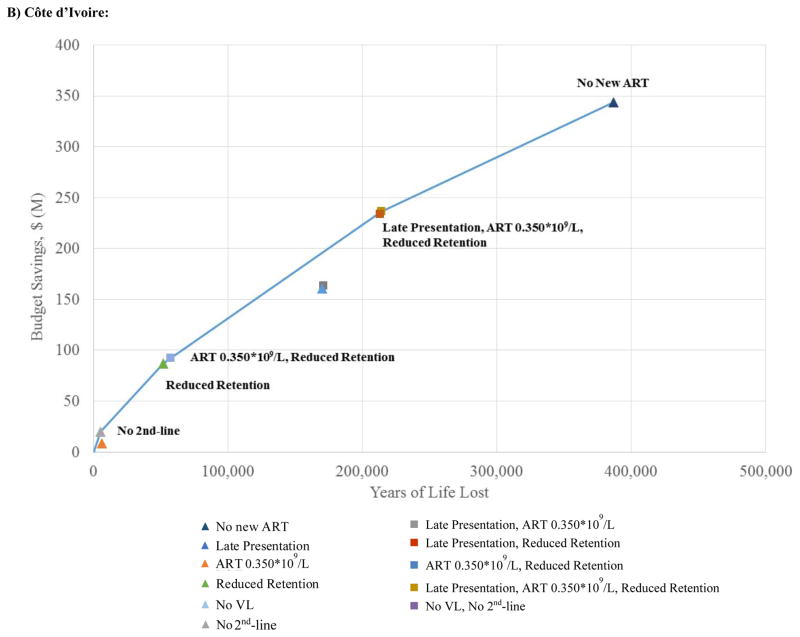
Figure 3. Efficiency frontier at ten years (results discounted at 3% per year) for alternative HIV programmatic cuts in the Republic of South Africa (A) and Côte d’Ivoire (B).
The figure aims to inform decision making by portraying 10-year outcomes on a discounted basis. Colored points indicate different programmatic scale-back strategies examined. Triangles designate single programmatic cuts; squares denote combination programmatic cuts. The solid line represents the efficiency frontier. Each point represents the projected discounted budgetary savings (vertical axis) and anticipated years of life lost (horizontal axis) for a given strategy. Decision makers can maximize years of life for a given budget by opting for strategies that lie on the efficiency frontier.


