
Fig. 3.
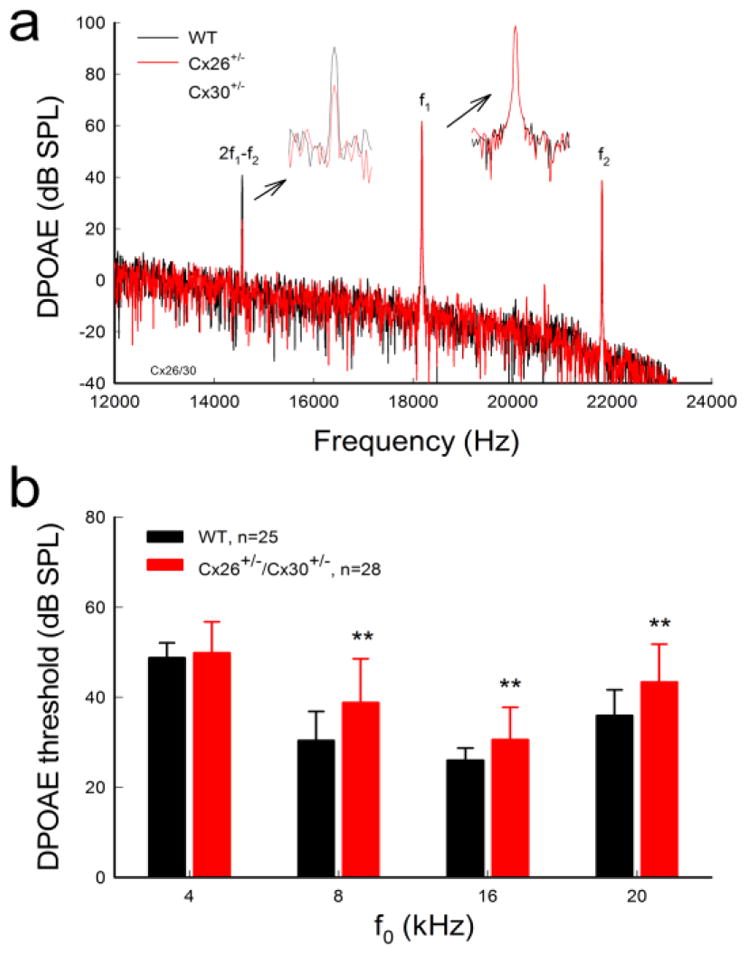
Reduction of DPOAE in Cx26+/−/Cx30+/− mice. a: Spectrum of acoustic emission recorded from Cx26+/−/Cx30+/− and WT mice. Insets: Large scale plotting of 2f1−f2 and f1 peaks. The peak of DPOAE (2f1−f2) in Cx26+/−/Cx30+/− mice was reduced but f1 and f2 peaks remained the same as those in WT mice. f0=20 kHz, I1/I2=60/55 dB SPL. b: DPOAE thresholds in Cx26+/−/Cx30+/− mice were increased. WT littermates served as control. Data are expressed as mean ± S.D. **: P < 0.001 as determined by one-way ANOVA with a Bonferroni correction.