Figure 7.

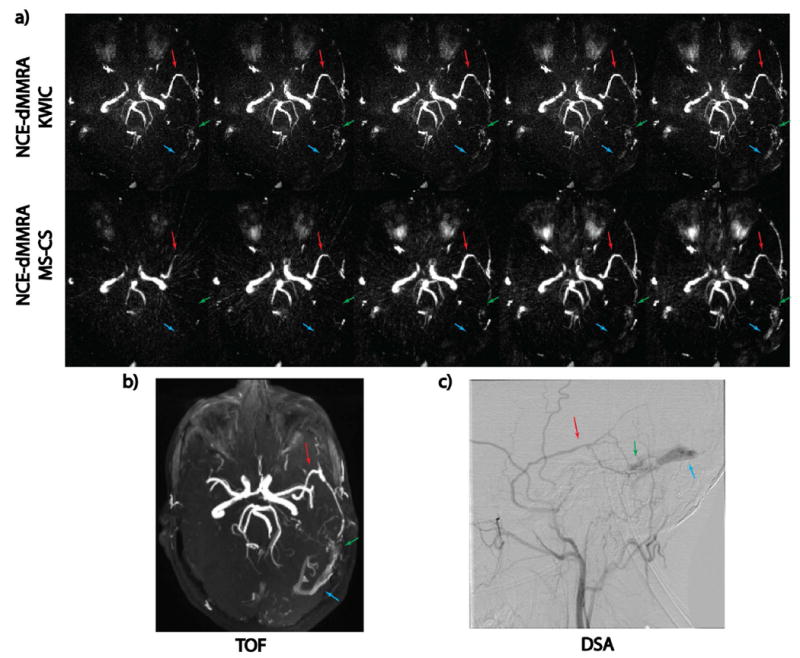
a). Example NCE-dMRA images of a AVF patient. From top to bottom, each row represents five frames of dynamic images reconstructed with KWIC and MS-CS, respectively. Anterior cerebral arteries were not visualized due to the tilting of the imaging slab. Images from MS-CS reconstruction sequentially display feeding artery (red arrow), fistula site (green arrow) and drainage into sinus (blue arrow). Such dynamic information is not as obvious in the KWIC reconstruction. b, c). Reference TOF and DSA images.
