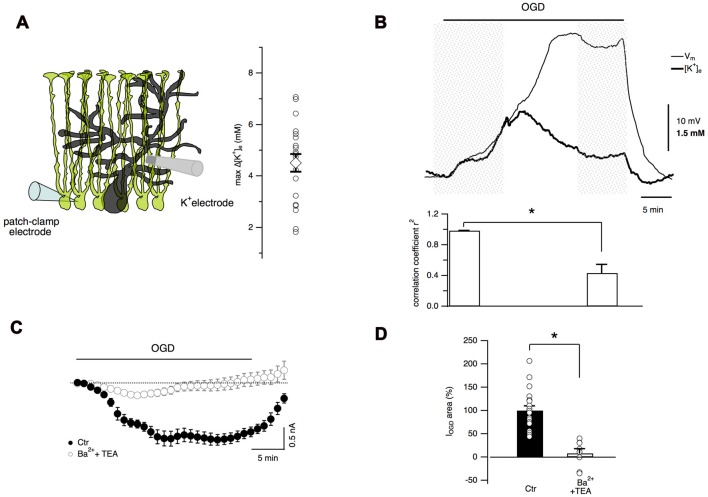
Figure 6.
Extracellular K+ accumulation during OGD partially account for Bergmann cell depolarization. (A) Extracellular K+ concentration is measured through an ion-sensitive microelectrode placed in the molecular layer. Maximal values of [K+]e variations recorded during OGD are reported in the plot (n = 22). (B) An example of simultaneous recordings of [K+]e changes and Bergmann glia membrane potential during OGD (top). Bottom: during the first 10 min of OGD protocol, the membrane potential and [K+]e increase concomitantly revealing high degree of correlation (n = 7) while after this time, [K+]e decreases and membrane depolarization increases further. The P value for the histogram data analysis is *P = 0.02, Wilcoxon Signed-rank test. (C) Mean currents recorded in control (n = 19) and in the presence of 5 mM Ba2+ and 10 mM TEA (n = 8). (D) These K+ channel inhibitors significantly reduce the electrical charge of Bergmann glia IOGD (*P = 0.0002).

