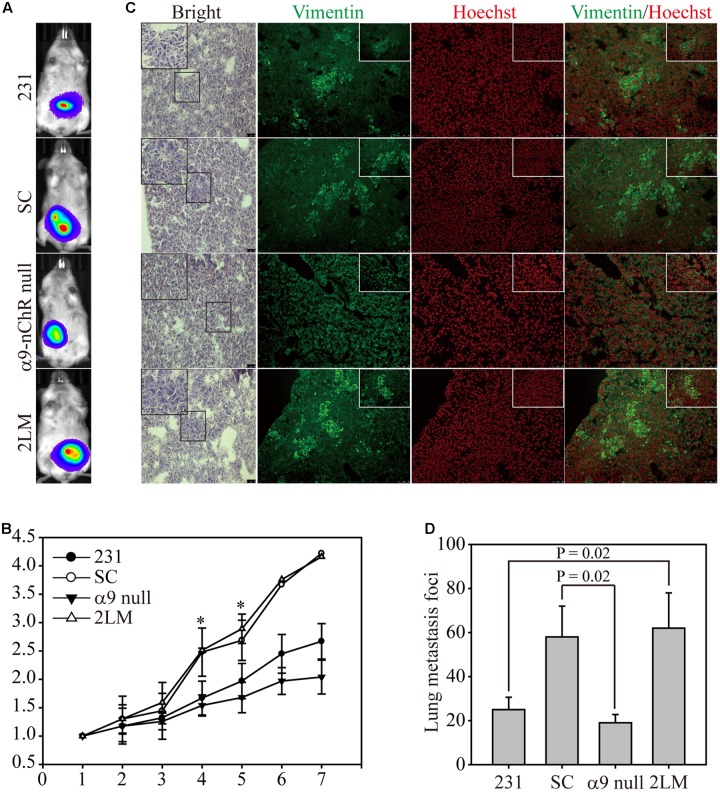
FIGURE 5.
2LM and α9-nAChR-null cells in the in vivo metastasis model. (A) Luciferase-labeled MB-231, SC, α9-nAChR-null, and 2LM cells were inoculated into SCID mice subcutaneously. The mice underwent weekly bioluminescence analysis for 3 weeks after injection. The bioluminescence images from the four types of tumors at 7 weeks are shown. (B) Growth of the four tumor types was determined by their bioluminescent activity. The tumor size for each mouse was based on the size fold change from week 1. (C) The lung tissue slides from each group were stained with H&E or IF with Vimentin (green) or Hoechst (red). Scale bar, 50 μm. The small photos were acquired by a high-power lens. Scale bar, 25 μm. (D) Metastatic tumor foci from all mice were counted by a low-power lens. The values are presented as the means and standard deviation errors. Data were analyzed with Student’s t-test; all P-values were two-sided. P-value less than 0.05 are indicated with an asterisk.

