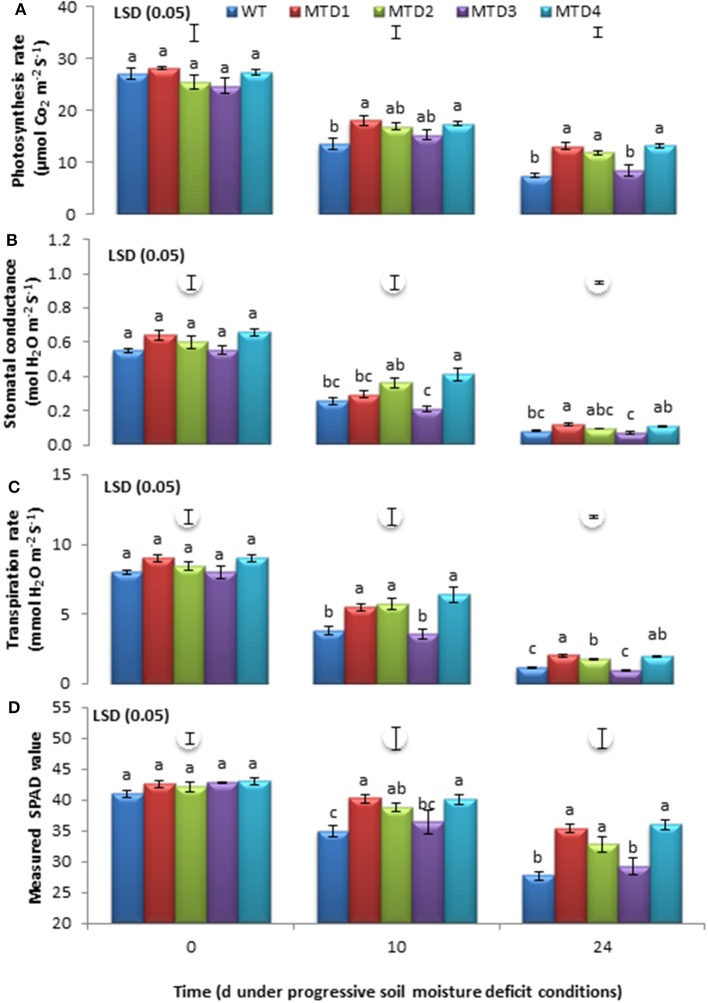
Figure 1.
Estimation of photosynthetic rate (A), stomatal conductance (B), transpiration rate (C), and SPAD values (D) of wild-type and transgenic lines at 0, 10, and 24 days under drought-stress conditions. The mean values ±SE (n = 3) followed by similar lower case letters within a column are not significantly different (P ≤ 0.05).

