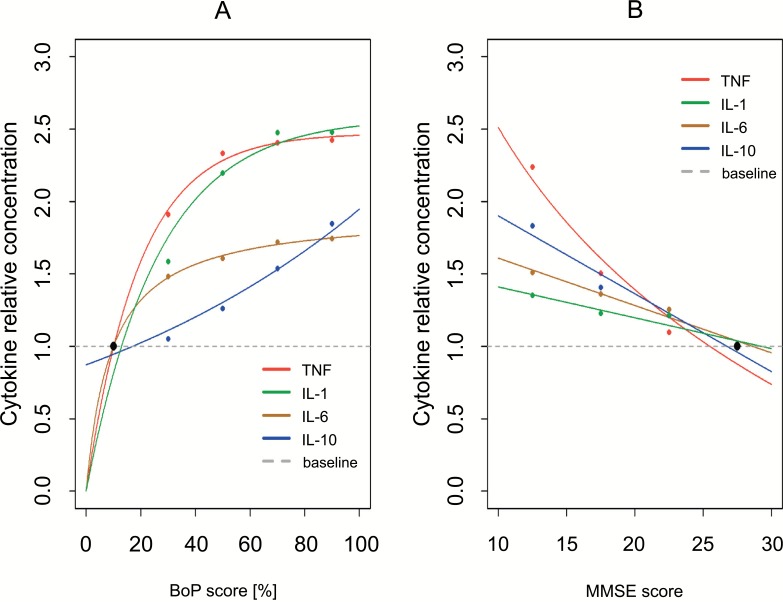
Fig. (1).
Association between the averages of cytokines levels and clinical parameters BoP score (A) and MMSE score (B).
Average concentrations are presented in relative scales, with minimal concentrations as a baselines (minimal concentrations taken as 1). Data presented in Table 1 and Table 2. The conditional averages of cytokines levels (points). Fitted curves were included (lines).

