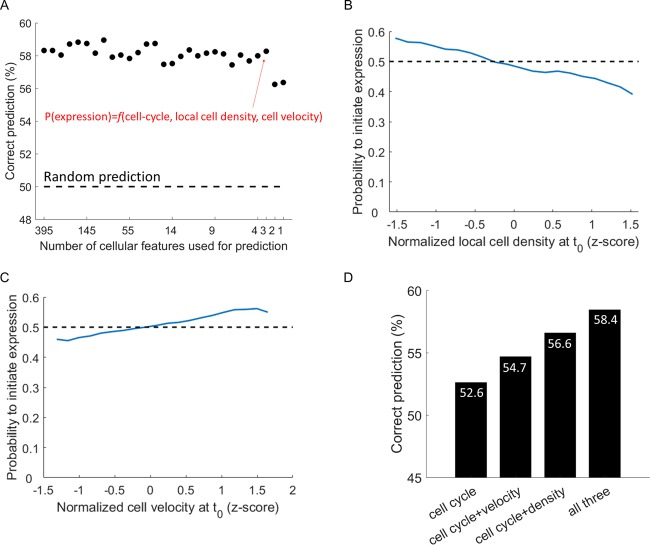
FIG 4 .
Gene expression success can be predicted to a degree based on three factors. (A) The correct prediction rate of a machine learning algorithm as a function of the number of features used in the prediction. The thin red arrow indicates the model with minimal number of features that still performs well. The model computes the probability of a single cell successfully initiating gene expression from the HSV-1 genome, P(expression), as a function (f) of three cellular parameters: cell cycle, local cell density, and cell velocity. (B and C) The probability of initiating CFP expression as a function of local cell density (B) or velocity (C) at the time of infection. The dashed black lines denote an infection probability of 0.5. (D) The correct classification rate increases when adding the cell velocity and local cell density data to the cell cycle data.

