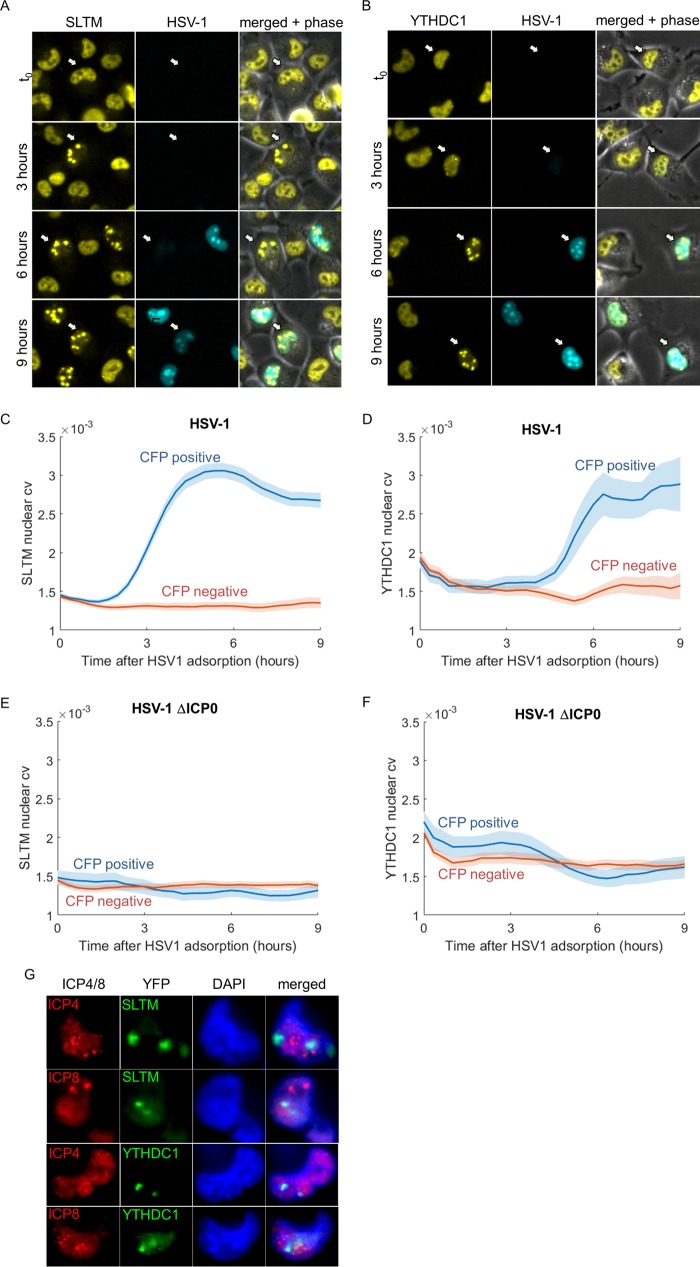
FIG 7 .
SLTM and YTHDC1 are redistributed upon HSV-1 infection. (A and B) Images of representative cells from time-lapse movies of SLTM-YFP (A) and YTHDC1-YFP (B). (C and D) SLTM (C) and YTHDC1 (D) nuclear coefficient of variance (cv) in CFP-negative (red) and CFP-positive (blue) cells following HSV-1 adsorption. The colored lines show the means, and the colored areas show the SEMs. (E and F) Nuclear cv of SLTM (E) and YTHDC1 (F) in CFP-negative (red) and CFP-positive (blue) cells following infection by a mutant HSV-1 that does not express ICP0. The colored lines show the means, and the colored areas show the SEMs. (G) Cells infected by HSV-1 were fixed and stained for ICP4 or ICP8 at 6 h after adsorption and imaged using an ×100 lens objective. Representative images of nuclear foci formed by SLTM (top two rows) or YTHDC1 (bottom two rows), which do not colocalize with ICP4 or ICP8 are shown. Cellular DNA was stained with 4′,6′-diamidino-2-phenylindole (DAPI) (blue).

