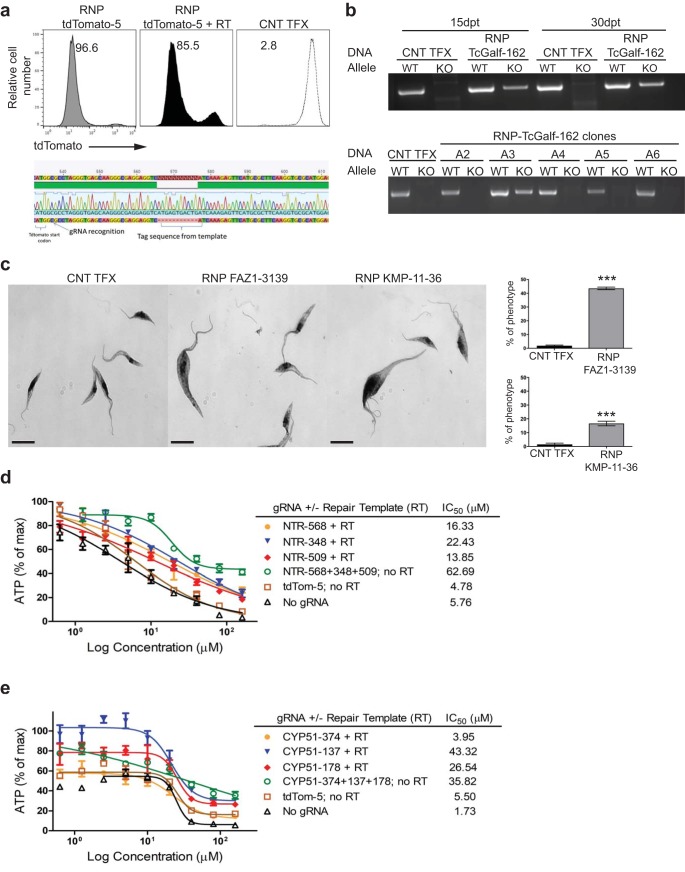
FIG 4 .
SaCas9/sgRNA-mediated homologous repair and knockout of essential genes. (a) T. cruzi epimastigotes expressing tdTomato were electroporated with water (CNT TFX; dashed line) or RNP complexes containing SaCas9/sgRNA tdTomato-5 (gray line) or this RNP complex plus a corresponding repair template which inserts a stretch of 3 in-frame stop codons into the tdTomato gene (grey filled). Sequencing of PCR products of the tdTomato gene from the tdTomato-negative population of the transfected parasites indicated successful insertion of 3 in-frame stop codons. The experiment was performed 3 times with similar results. (b) DNA isolated from uncloned (top) or cloned (bottom) T. cruzi epimastigotes (Brazil strain) that were transfected with water (CNT TFX) or with RNP complexes containing SaCas9 and an sgRNA designated TcGalf-162, targeting T. cruzi Galf (TcGalf) genes. WT, PCR result for wild-type allele; KO, PCR result for edited allele. Note that the results for day 15 and 30 uncloned epimastigote populations and clone A3 indicate the presence of both wild-type and edited alleles; other clones and control transfected parasites have wild-type alleles only. (c) Representative bright-field microscopy images of T. cruzi epimastigotes that were transfected with water (CNT TFX) or with RNP complexes containing SaCas9 and an sgRNA targeting FAZ1 (designated FAZ1-3139) or KMP-11 (designated KMP-11-36) genes. Bar graphs indicate the average percentage of parasites with a morphological defect/phenotype (e.g., greatly enlarged and multiflagellated parasites) for each group at 2 days (FAZ1) and 4 days (KMP-11) after transfection. Bar = 5 µm. Graphs are representative of 4 independent experiments, with data presented as mean values ± standard errors of the means (SEM). Faz1, 43.54 ± 0.4599, versus water control, 1.873 ± 0.2132; 95% confidence interval, −42.90 to −40.42. KMP-11, 16.60 ± 0.8253, versus water control, 1.466 ± 0.4684; 95% confidence interval, −17.46 to −12.81. ***, P < 0.0001, as determined by the unpaired, two-tailed Student t test. (d, e) Dose response curves of NTR (d) or CYP51 (e) knockdown epimastigotes under treatment with BZ (d) or POS (e). IC50 was determined as the drug concentration that was required to inhibit 50% of ATP production compared to that of parasites with no drug exposure (calculated with GraphPad Prism 5.00; GraphPad Software, Inc., San Diego, CA). Results are representative of 3 replicate experiments with similar outcomes.

