
Figure 3.
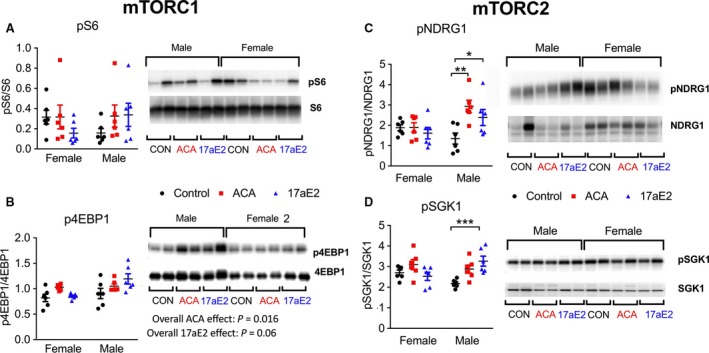
Activation of mTOR substrates in livers of mice treated with 17aE2. From liver samples taken at 12 months of age (n = 6 per group per sex). Statistics showing overall effects (B) represent the P‐value for a treatment parameter in a two‐way ANOVA that also included a parameter for sex. * represents P < 0.05; ** represents P < 0.01; *** represents P < 0.005 from a Student's t‐test conducted on the data separately from each sex.