
Figure 5.
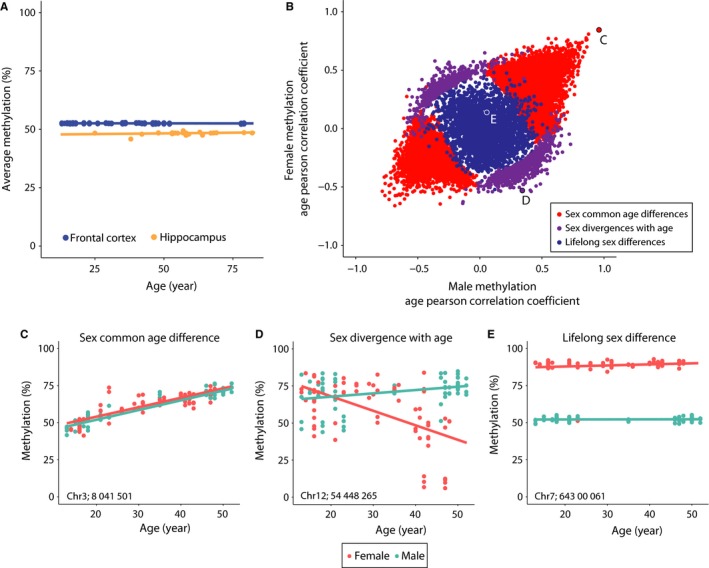
Methylation changes with aging and sex differences in the human central nervous system (CNS). A) Publicly available human methylation data from hippocampus and frontal cortex demonstrate no change in mean CG methylation with age. B) Using the fontal cortex data, for which there is a larger samples size and equal distribution between sexes, a general linear model was used to determine individual sites with significant age, sex, or interaction effects on methylation level. Plotted by Pearson's correlation coefficients to age by females (y‐axis) and males (x‐axis), sites with sex‐common age‐related decreases in methylation (red, bottom left) and increases in methylation (red, top left) are evident. Sites with sexually divergent response to aging (significant interaction effect) are in purple. Lifelong sex differences are plotted in blue. Sites without any significant factor of age or sex are not shown to improve clarity. C) Example site of a sex‐common age‐related differentially methylated site. D) Example of sexually divergent response to aging. E) Example of lifelong sex difference. Locations of specific sites are given and are also highlighted in panel B.