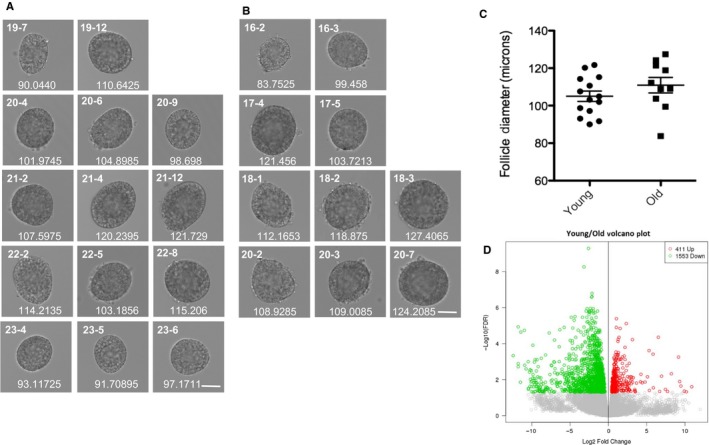
Figure 2.

RNA‐Seq on individual follicles from reproductively young and old mice reveals differential gene expression despite indistinguishable morphology. Brightfield microscopy images of all follicles from reproductively (A) young and (B) old mice, which were processed for individual follicle RNA sequencing and analysis. Each row shows follicles that were isolated from an individual mouse. Each follicle's unique identifier used throughout the manuscript is listed at the top left corner of each image. The mean diameter (μm) for each follicle, determined by taking the mean of two perpendicular measurements, is shown at the bottom of each image. The scale bar is 50 μm. (C) The graph shows the mean follicle diameter measurement of each follicle shown in (A) and (B). A t‐test was performed and there was no difference in diameters between the age cohorts (P = 0.2338). (D) Genes that are overall differentially expressed between follicles from reproductively young and old mice are shown in a volcano plot. Genes that are expressed more highly in young are shown in red (411), and those that are more highly expressed in old are shown in green (1553).
