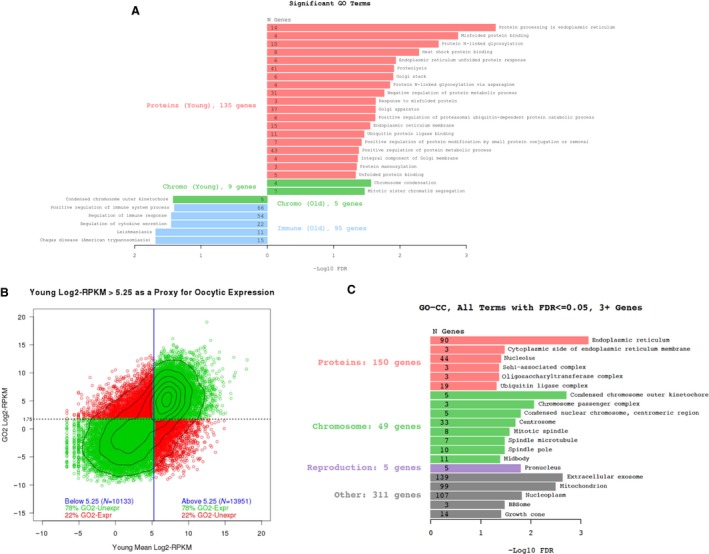
Figure 4.

Genes involved in proteostasis are differentially expressed with age in the growing oocyte. (A) The butterfly plot shows the major trends in significantly enriched GO terms from the differentially expressed genes within the intact follicle. Terms enriched in young samples are on the right, and terms enriched in the old samples are on the left. The x‐axis is the –log10 of BH‐corrected P‐value. Numbers in bars indicate the total number of differentially expressed genes with the specified term. (B) Genes were assigned to ‘oocyte’ based on their expression in publicly available data. (C) Cellular component GO terms from the differentially expressed genes assigned to the oocyte reveal previously known age‐based signatures (i.e., mitochondria, spindle, microtubules, chromosomes) as well as a new category involved in proteostasis (red).
