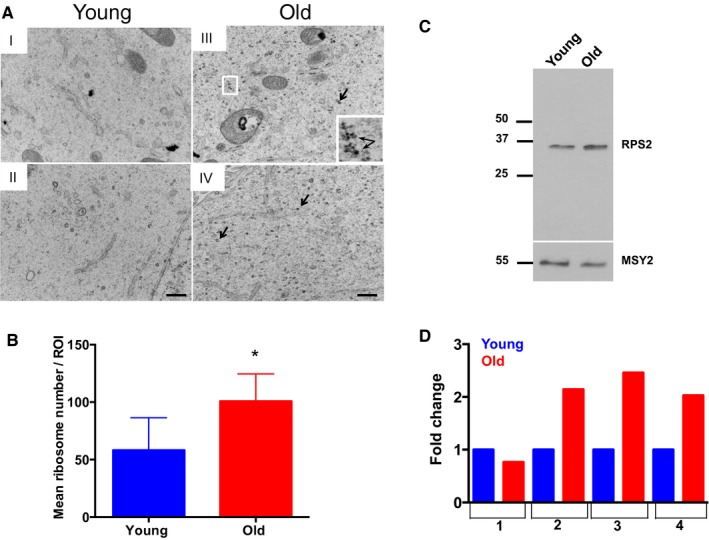
Figure 6.

Oocytes from reproductively old mice have increased ribosome numbers. (A) Representative transmission electron microscopy (TEM) images of the cytoplasm of oocytes from reproductively young (I, II) and old (III, IV) mice are shown. Arrows and the boxed region and inset highlight ribosomes. The scale bar is 500 nm. (B) Ribosome number was quantified using image j, and the graph shows the average number of ribosomes per defined region of interest in oocytes from reproductively young and old mice. A t‐test was performed, and the asterisks denotes P = 0.0139. (C) Oocyte protein extracts from reproductively young and old cohorts were processed for immunoblot analysis with an RPS2 antibody (10 oocytes/lane). The immunoblot was reprobed with an antibody against the oocyte‐specific protein MSY‐2 as a loading control. (D) The graph shows the fold change in RPS2 expression in young and old cohorts from four independent experiments. The overall fold increase in RPS2 expression across experiments was 1.851 (P = 0.0627).
