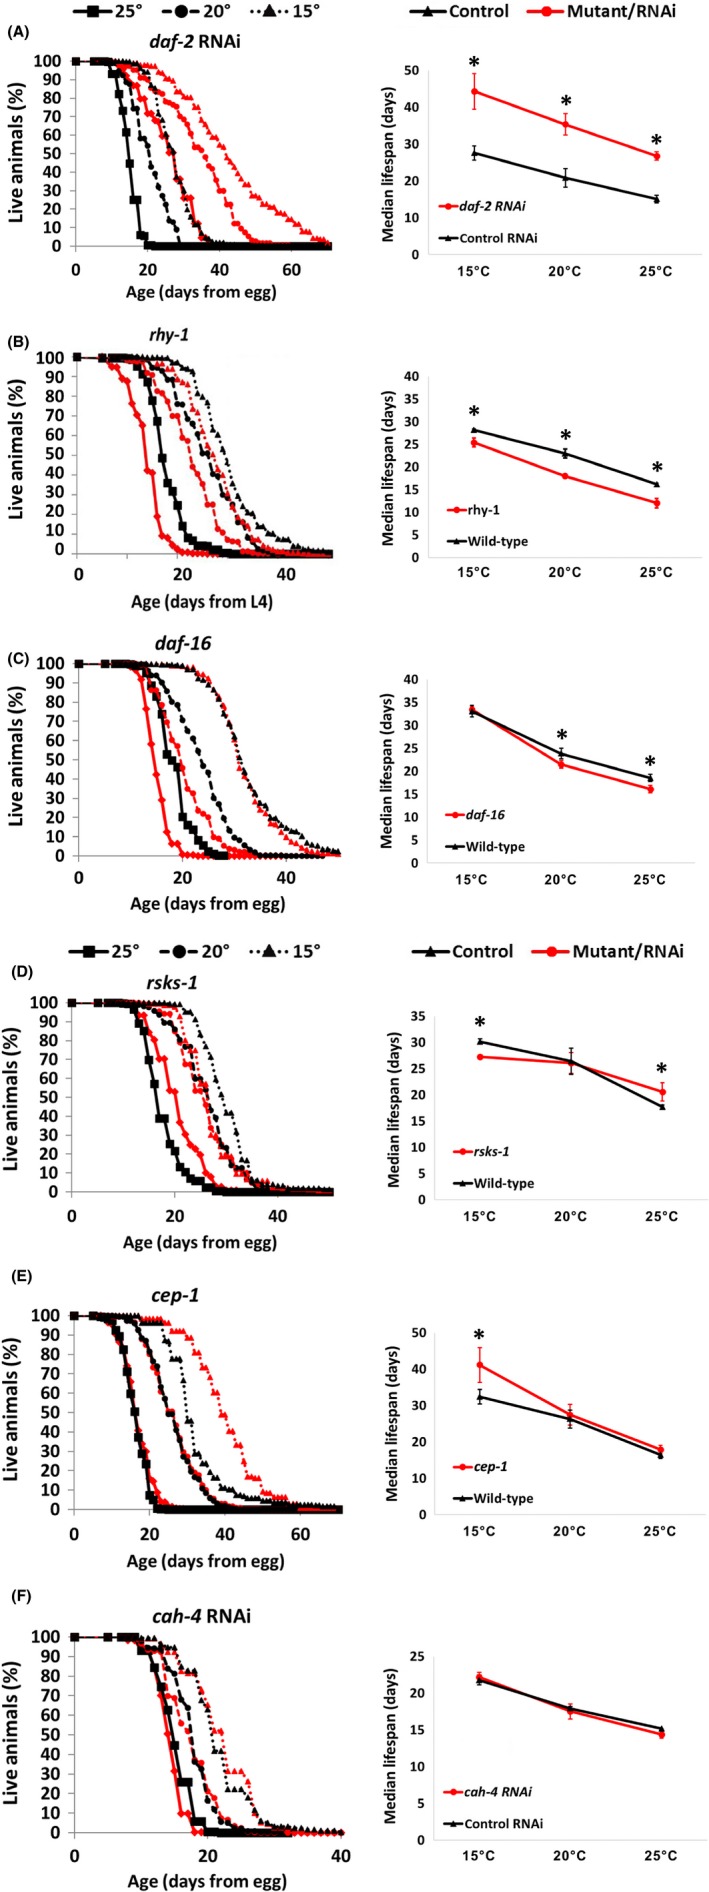
Figure 1.

Examples of different types of interactions between genotype, temperature, and lifespan. (A–F) show survival curves and combined graphs plotting median lifespan vs temperature at 15°, 20°, and 25° for daf‐2 (RNAi), rhy‐1(ok1402), daf‐16(mu86), rsks‐1(ok1255), cep‐1(gk138), and cah‐4 (RNAi) compared to wild‐type (N2). Note that because they are developmentally delayed, rhy‐1 lifespans are shown from L4. All lifespans are available in Figs. S1–S3 (Supporting Information). Significant (P < .05) differences between control and experimental conditions denoted with asterisks (*).
