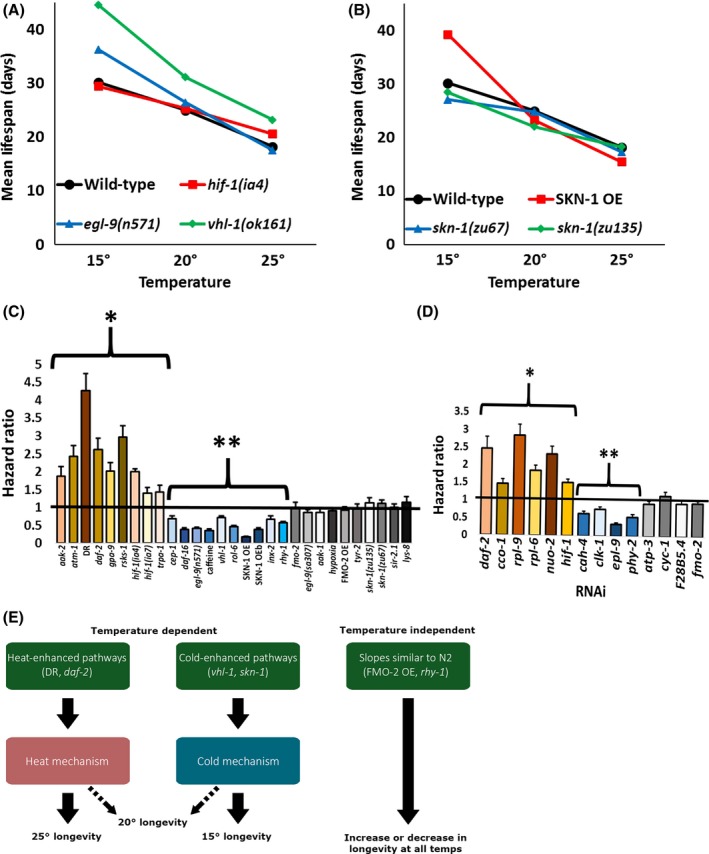
Figure 2.

Temperature vs. longevity across genotypes. (A–B) plot median lifespan vs temperature at 15, 20, and 25 °C for opposing genetic conditions in the longevity pathways of hypoxic signaling and antioxidant signaling normalized to wild‐type (N2). (C–D) show the Cox regression‐calculated hazard ratios between each condition, separated into UV‐killed and RNAi conditions, across temperatures. (E) depicts a basic model. Significant (P < 0.01) increased (*) and decreased (**) hazard ratios at 15 °C compared to 25 °C are denoted.
