Figure 3.

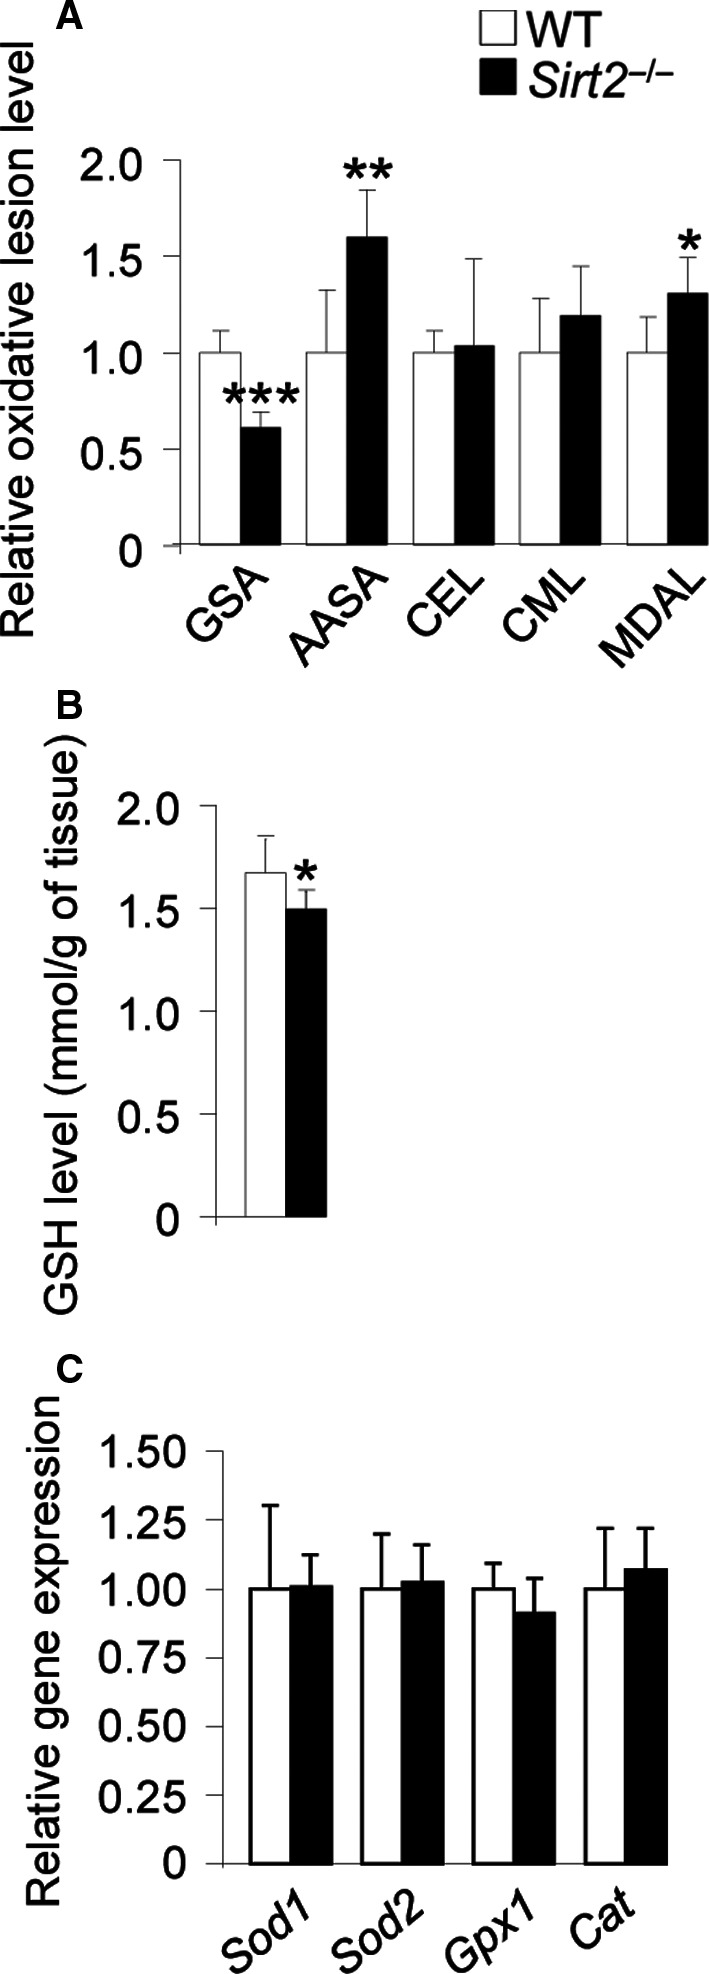
Redox imbalance in spinal cord from Sirt2 −/− mice. (A) GSA, AASA, CEL, CML, and MDAL levels and (B) GSH levels and (C) relative mRNA levels of Sod1, Sod2, Gpx1, and Cat in spinal cord from WT and Sirt2 −/− mice at 13 months of age (n = 8/genotype). Data represent mean ± SD. Statistical analysis was carried out with Student's t‐test (*P ≤ 0.05, **P ≤ 0.01, ***P ≤ 0.001).
