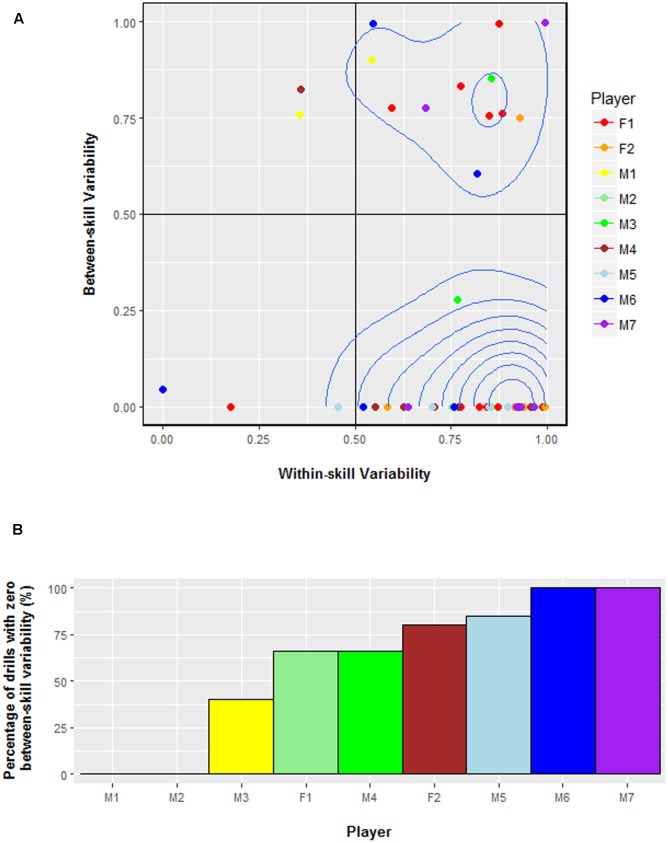
FIGURE 3.
(A) Between-skill and within-skill variability values for every serving drill by each player in Study 1. A 2-D density plot was added to the figure to highlight the most common between-skill and within-skill variability values. A value of 0 represents minimum variability whereas 1 represents maximum variability. (B) The percentage of drills that featured zero between-skill variability for each player in Study 1. The number of drills assessed per player were: M1 = 2, M2 = 8, M3 = 2, M4 = 7, M5 = 4, M6 = 5, M7 = 6, F1 = 15, F2 = 5. Hence, the two players that did not experience any drills with zero between-skill variability had the least number of serving drills assessed.

