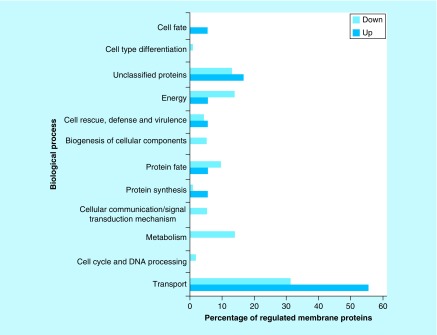
Figure 2. . Functional classification of membrane proteins regulated by zinc availability.
The database FunCat2 was used to perform this classification. Light gray bars represent downregulated proteins and dark gray bars represent upregulated proteins. Proteins upregulated: Transport – 56% (10 proteins), Cell cycle and DNA processing – 0% (0 protein), Metabolism – 0% (0 protein), Cellular communication – 0% (0 protein), Protein synthesis – 6% (1 protein), Protein fate – 6% (1 protein), Biogenesis of cellular components – 0% (0 protein), Cell rescue – 6% (1 protein), Energy – 6% (1 protein), Unclassified – 17% (3 proteins), Cell-type differentiation – 0% (0 protein), Cell fate – 6% (1 protein). Proteins downregulated: Transport – 31% (36 proteins), Cell cycle and DNA processing – 2% (2 proteins), Metabolism – 14% (16 proteins), Cellular communication – 5% (6 proteins), Protein synthesis – 1% (1 protein), Protein fate – 10% (11 proteins), Biogenesis of cellular components – 5% (6 proteins), Cell rescue – 4% (5 proteins), Energy – 14% (16 proteins), Unclassified – 13% (15 proteins), Cell-type differentiation – 1% (1 protein), Cell fate – 0% (0 protein).

