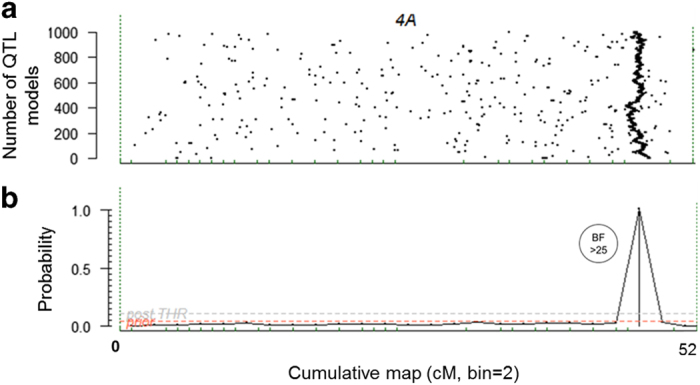
Figure 2.

Posterior probability of PF QTL positions and traces of the QTL models along LG 4A for an additive genetic model. (a) Traces of number of QTL models: each black dot represents an independent QTL model and the consistent vertical line of black dots at the end of the chromosome indicates presence and location of the QTL, (b) posterior probability of QTL positions, BF=Bayes factor. BF > 25 is confirmation of a decisive evidence of presence of a QTL.
