. 2017 Sep 12;8(11):7510–7520. doi: 10.1039/c7sc03514d

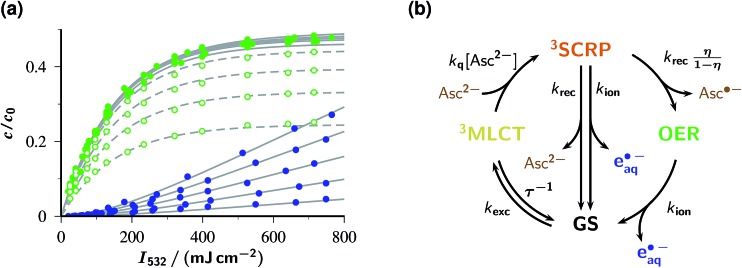
Fig. 3. Response of the catalytic system to the laser intensity and the concentration of the sacrificial donor. Graph (a), initial post-flash concentrations c relative to the starting Rubpy concentration c 0 (50 µM) for OER (green) and eaq˙ (blue) as functions of the intensity I 532 of a single green laser flash with the Asc2– concentration as parameter. The gray curves represent a global fit for the kinetic scheme shown in (b); best-fit parameters with the effective laser pulse duration T and with the intensities I 532 specified in mJ cm–2, k exc T = 6.6 × 10⁻³ I 532, T/τ = 1.7 × 10⁻², k q T = 42 M–1, k rec T = 0.94, η = 0.48, k ion T = 6.0 × 10⁻⁴ I 532. The ascorbate weight-in concentrations, in ascending order of the curves for each observed species, are 0.5 mM, 1 mM, 2 mM, 5 mM (open symbols and dashed curves, OER only; for clarity, the data and fit curves for eaq˙ have been omitted) and 10 mM, 20 mM, 50 mM, 100 mM, 250 mM (filled symbols and solid curves). Experimental temperature, 303 K. Graph (b), enhanced kinetic model used for the global fit, with 3SCRP being the spin-correlated radical pair Inline graphic. For further explanation, see text.

Fig. 3