. 2017 Sep 12;8(11):7510–7520. doi: 10.1039/c7sc03514d

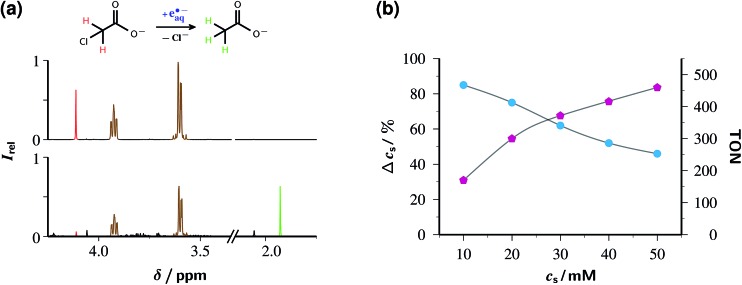
Fig. 6. Detoxification of chloroacetate ClAcA with the green-light driven catalytic system of this work. Graph (a) depicts the gross reaction above the 1H-NMR spectra before (upper trace) and after (lower trace) laser irradiation (532 nm, 600 mJ cm–2, 10 Hz repetition rate, 1 h illumination time) of an aqueous solution (pH 12.65) of 50 µM Rubpy and 45 mM of Asc2– (after correction for residual AscH) initially also containing 10 mM ClAcA. Both spectra were recorded after acidic workup (pH 1), and their vertical scales are identical. Signal assignment and colour code: chloroacetic acid, 4.11 ppm (s), red; acetic acid, 1.93 ppm (s), green; ascorbic acid, 3.93 ppm (m) and 3.60 ppm (m), brown. Graph (b) displays the outcome of a series of such experiments with identical illumination conditions, pH and catalyst concentration as in (a) but 89 mM Asc2– (corrected) and the ClAcA concentration c S as the independent variable. Workup and detection as in (a). Circles, cyan, left vertical scale, relative substrate consumption Δc S; pentagons, magenta, right vertical scale, TON. The gray lines are spline fits to guide the eye. For further details, see text.

Fig. 6