Figure 6.
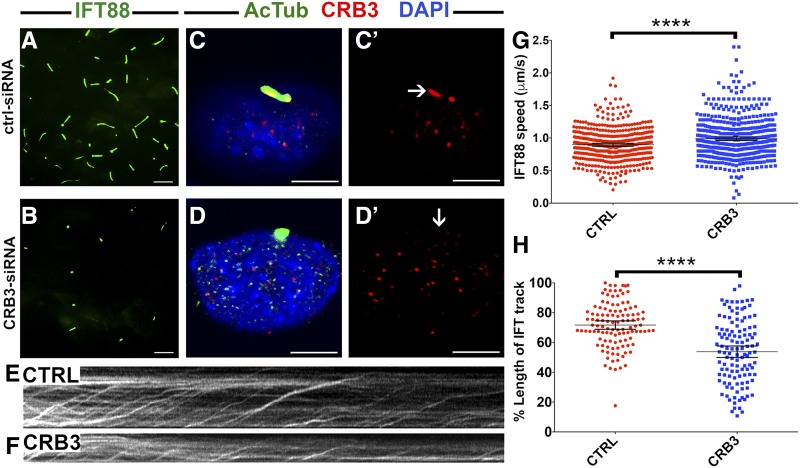
CRB3 knockdown in mammalian cells affects intraflagellar transport (IFT) dynamics. (A and B) Maximum projections of total internal reflection fluorescence (TIRF) time-lapse recordings of IMCD3 cells grown on transwells and transfected with scrambled Ctrl-small interfering RNA (siRNA) (A) or CRB3-siRNA (B). These cells are stably transfected with an IFT88-GFP construct to visualize intraflagellar transport (green signal). (C–D’) Confocal images of control (CTRL) siRNA- (C and C’) and CRB3 siRNA-treated (D and D’) IMCD3 cells. Cilia are stained with antibodies to acetylated tubulin (AcTub) (green) and Crumbs (red). Samples are counterstained with DAPI to mark nuclei (in blue). (E and F) Kymographs of IFT movement in an IMCD3-IFT88 cell line transfected with CTRL or CRB3 siRNA as indicated. (G) Graph showing the speed of IFT particle movement in cilia of IFT88-GFP IMCD3 cells. Date collected from three independent experiments. (H) Lengths of IFT tracks in CTRL siRNA- and CRB3 siRNA-transfected cells expressed as percentages of total cilia length. Data are collected from two independent experiments. In (G and H), the mean and 95% C.I. are indicated. P < 10−4 based on Student’s t-tests. Bar, 10 μm (A and B) and 5 μm (C–D’).

