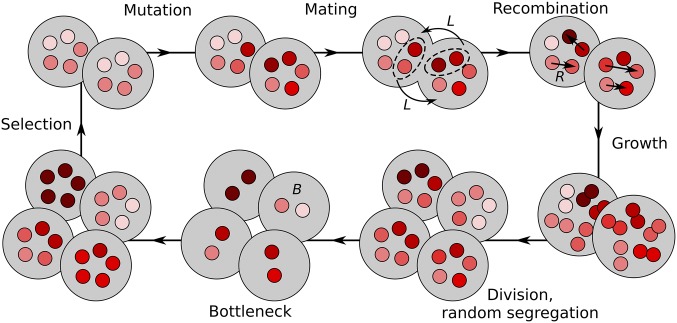
Figure 1.
Model life cycle. Each cell contains M mitochondrial genomes (red circles), accumulating mutations (shades of red) in their K loci (not shown). Mating is modeled as paternal leakage with rate L and mitochondrial recombination (rate R). Cells then replicate their mitochondrial populations and divide randomly-segregating mitochondria to the two daughter cells. Mitochondrial bottleneck is modeled as random reduction of the number of mitochondria per cell from M to B, and subsequent amplification back to M. The life cycle ends with selection against cells with lowest mitochondrial fitness.

