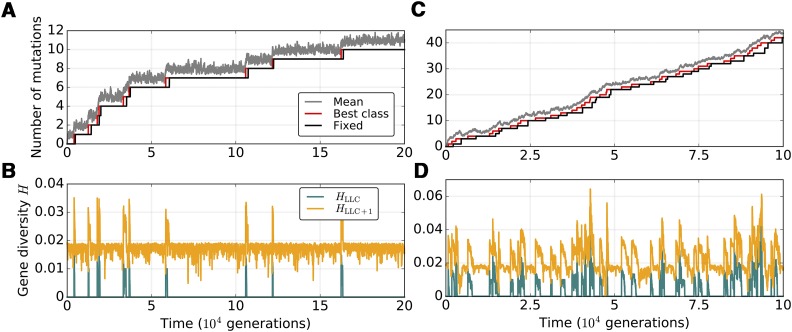
Figure 2.
Mutation accumulation profiles in mitochondrial genomes of a small eukaryotic population with no recombination. (A and C) Population mean of the deleterious mutation load (gray), the number of mutations in the least-mutated genome class (red), and the number of mutations fixed within the population (black). (B and D) Gene diversity in the least-loaded (teal, HLLC) and the second least-loaded class (orange, HLLC+1). Population size is set to N = 500, M = 20, µ = 0.005, and C = 1. Here, s = 0.02 and K = 100. The rate of paternal leakage is L = 0.8 (A and B) or L = 5.0 (C and D).

