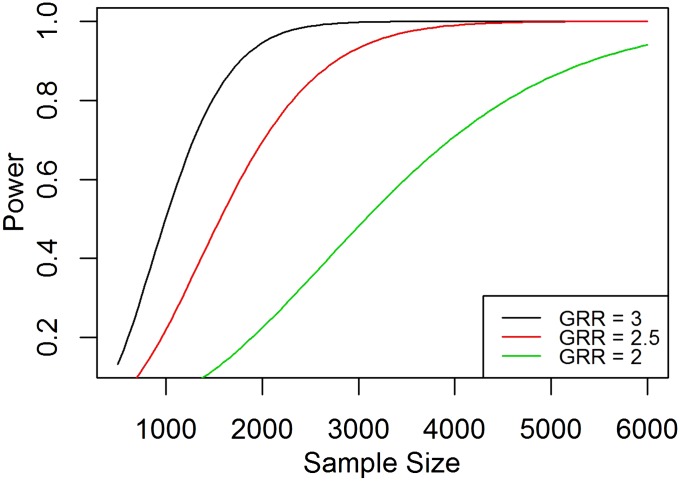
Figure 1.
Power as a function of sample size for different genotype risk ratios. The graphs show the power as a function of sample size for case-control study design assuming multiplicative mode of inheritance with genotype risk ratio (λ) = 3, 2.5, and 2, respectively. Power is computed using the function PowerDiscreteGRR() with the admixture proportion = 0.8, risk allele frequencies and for a one-sided test, and adjusted type-I error rate = 0.000025. GRR, genotype risk ratio.

