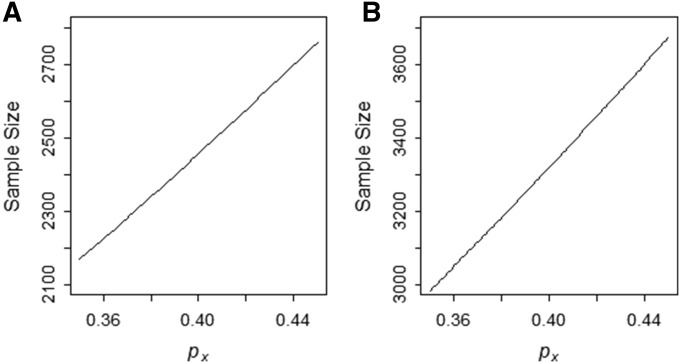
Figure 2.
Sample size as a function of allele frequency of the risk allele in population X. The graph shows the number of individuals in case sample to detect the allele frequency difference of 0.3 between the ancestry populations for different value of (A) The graph with (that is, population X is the high-risk population) with varying from 0.35 to 0.45. (B) The graph with (that is, the population Y is the high-risk population). Sample size is computed using the function SampleDiscreteGRR() with the admixture proportion admixture proportion = 0.8, the genotype risk ratio (λ) = 2, multiplicative mode of inheritance, and the two-sided test with adjusted type-I error rate = 0.000025 and type-II error rate = 0.2.

