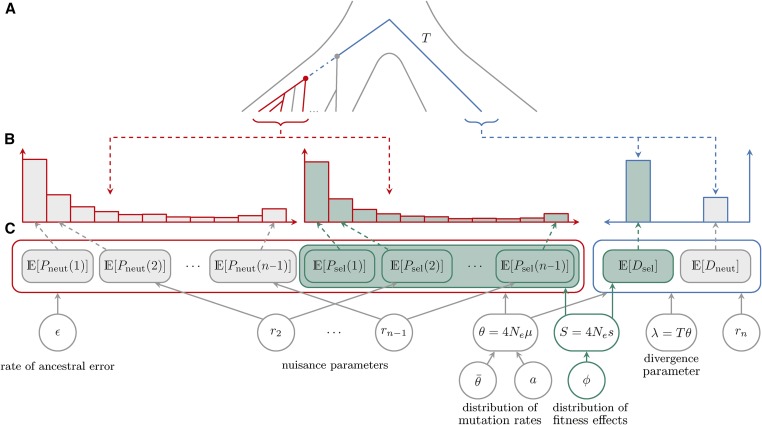
Figure 1.
Schematic of data and the hierarchical model assumed in the inference method. Throughout the figure, gray and blue fill indicates sites that are assumed to be evolving neutrally or potentially under selection, respectively; while red and blue outlines indicates polymorphism and divergence data (expectations), respectively. (A) The history and coalescent tree of two populations: the ingroup (on the left side), for which polymorphism data are collected, and the outgroup (on the right side), for which divergence counts are obtained. A total of n sequences are sampled from the ingroup (marked in red), with the MRCA marked with a red circle. The MRCA of the whole ingroup population is marked with a gray circle. From the outgroup we typically have access to one sequence (marked in blue). The total evolutionary time between the MRCA of the sample (red circle) and the sampled outgroup sequence can be divided into the time from the MRCA of the sample to the MRCA of the whole ingroup population (blue dot–dash line) and T, the time from the ingroup MRCA to the sampled outgroup sequence (blue solid line). (B) Observed SFS and divergence counts [ and with and ]. (C) Expected counts [ and with and ], model parameters, and relations between parameters, expectations, and data. The dashed gray and blue ↓’s connect observed counts from (B) with matching expected counts from (C).

