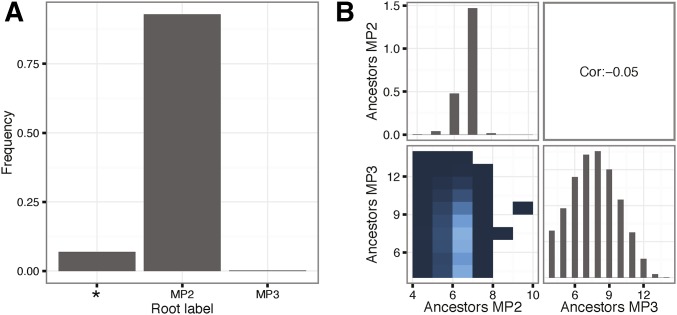
Figure 4.
Root label and number of unique ancestors. (A) shows the density of the three possible root labels [MP2, MP3, or equivocal (*); statistical probe 1], and (B) shows the joint and marginal distributions of the number of unique ancestors assuming MP2 or MP3 as the donor. Lighter color in the joint distribution indicates higher density, and white indicates no data. The overall Pearson correlation between MP2 and MP3 number of ancestors was very low at −0.05. Statistics were calculated on a set of 232,000 phylogenies sampled from the posterior distribution after burn-in based on the real sequence data.

