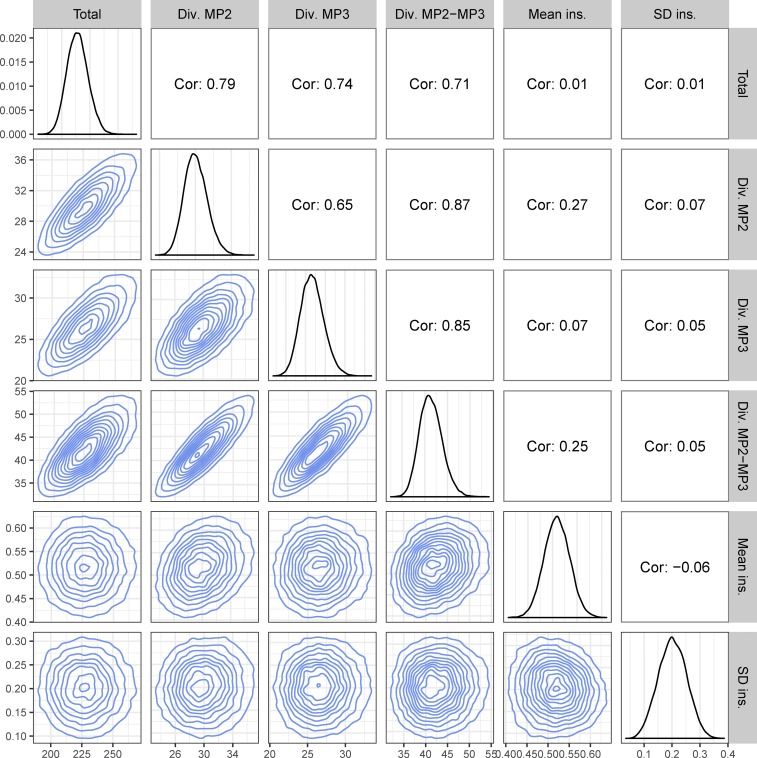
Figure 5.
Diversity measures and ancestor heights. This figure shows the marginal (diagonal) and pairwise joint (lower triangle) distributions for the diversity and ancestors height statistics (statistical probe 4). The upper triangle shows the pairwise Pearson correlations. Diversity (Div.) and sum of all tree branches (Total) are in units of number of nucleotide substitutions, and the mean ancestor insertion height (Mean ins.) is on a relative root-to-tip 0–1 scale. Statistics were calculated on a set of 232,000 phylogenies sampled from the posterior distribution after burn-in based on the real the sequence data.

