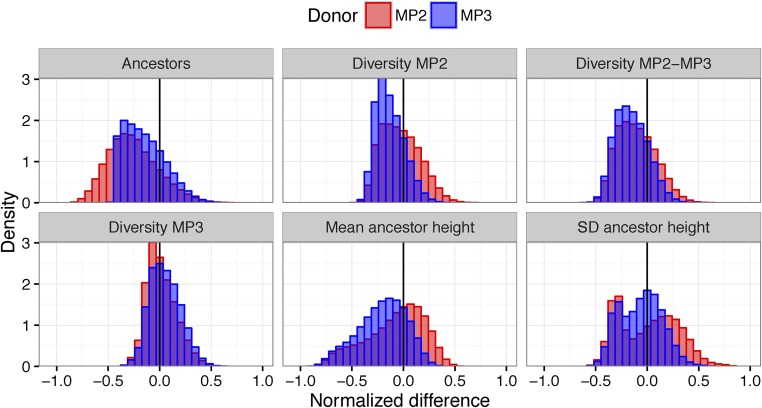
Figure 6.
Normalized difference in empirical and simulated statistics stratified by donor in the superinfection model. Each panel shows the estimated difference in a statistic (Number of unique Ancestors, Diversity in MP2, Diversity between MP2 and MP3 taxa, Diversity in MP3, Mean ancestor height, and SD of the ancestor height). The distributions show the results from randomly selecting a phylogeny from the posterior conditional on the observed sequences and a random simulation from the prior for the superinfection model. Values are normalized to be in [0,1] so they can all be plotted on the same axis. Blue distributions are from simulations with MP3 as donor, and red with MP2 as donor. Densities closer to zero mean that the simulation tends to give values of the statistics that are probabilistically close to the empirically observed values. Typically, simulations with MP3 as donor better reflected the empirically observed trees.

