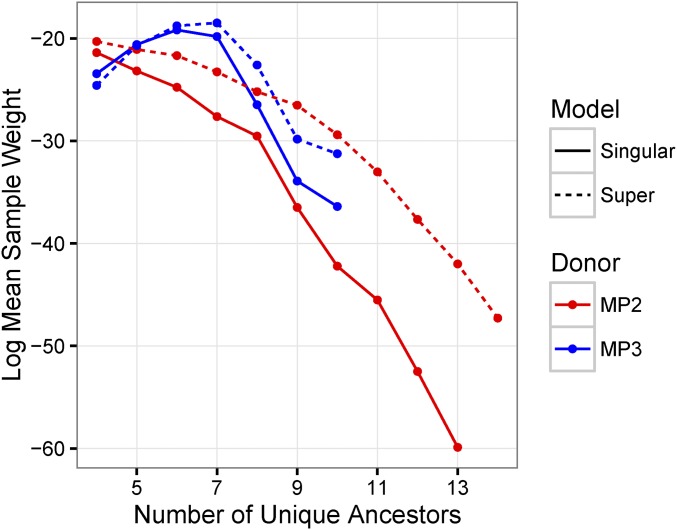
Figure 7.
Log mean sample weight stratified by number of unique ancestors. This figure shows the natural log of the mean sample weight stratified by the number of unique ancestors in samples from the prior distribution for the singular-infection model (solid lines), the superinfection model (dashed lines), with donor being either MP2 (red lines), or MP3 (blue lines). The mean sample weight is highest in the superinfection model when MP3 is the donor and there are seven unique ancestors. This is due to the fact that, in this stratum, the simulation tends to get higher density values of the remaining statistics.

