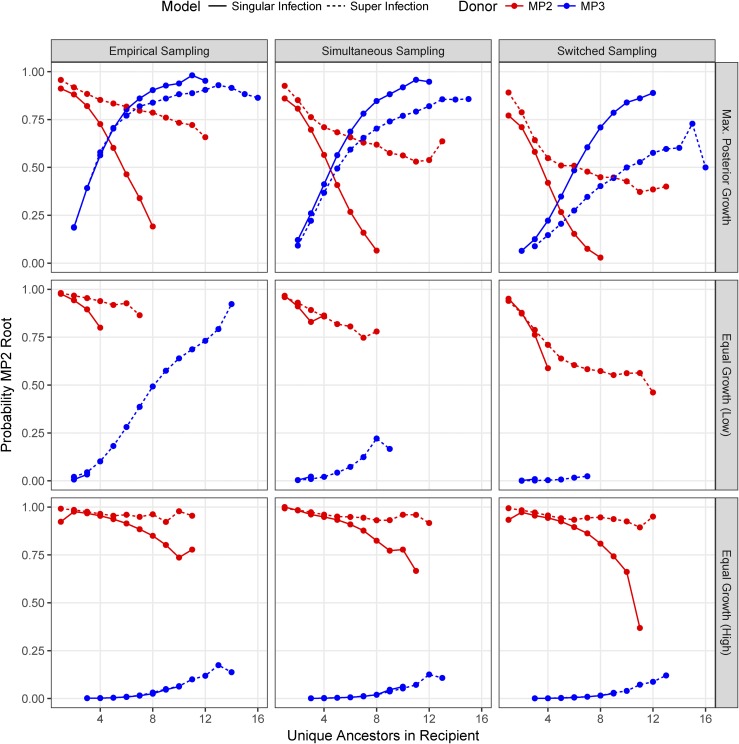
Figure 8.
Probability of obtaining MP2 root label stratified by number of unique ancestors in the recipient given alterative sampling and population growth assumptions. Each panel represents the results of simulations. The red lines indicate that the donor was MP2 while blue indicates that the donor was MP3. Solid lines show the single-infection model while dashed lines show the superinfection model. Panels in the “Empirical Sampling” column assumed the same sampling times as was actually observed (MP3 sampled 588 days before MP2), the “Simultaneous Sampling” column assumed that sampling of MP2 and MP3 occurred at the same time at the midpoint of the actual sampling times, and the “Switched Sampling” column assumed that the sampling times are switched. Panels in the “Max. Posterior Growth” row have and equal to the mean values from the posterior distribution, the “Equal Growth (Low)” row have the “Equal Growth (High)” row have

