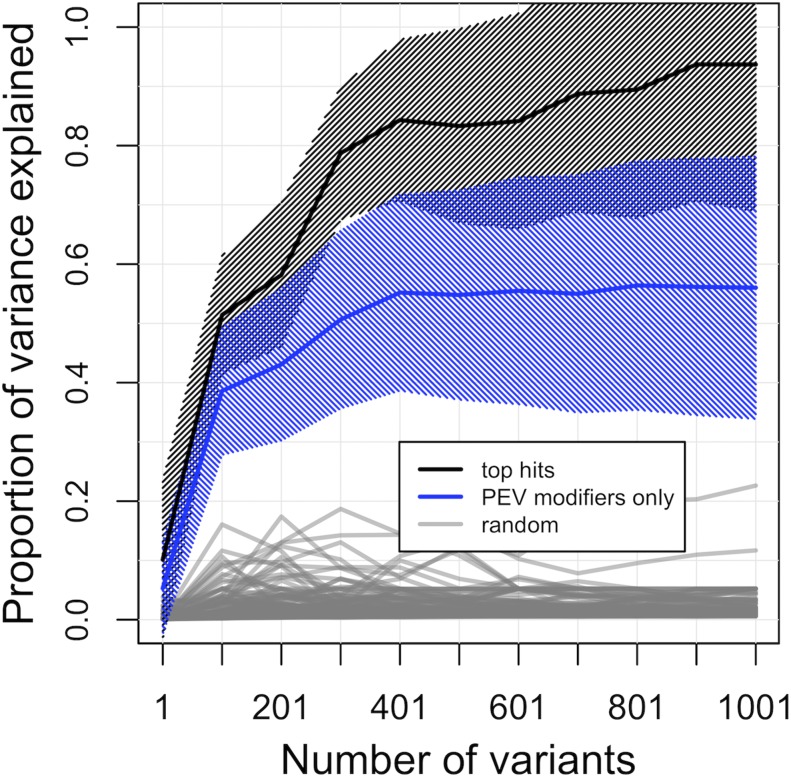
Figure 2.
Proportion of among-line phenotypic variance explained within the Df(2L)2802 second chromosome population using GCTA. Comparisons between SNP groupings include; the most significant GWA variants (black line), variants within know PEV modifiers only (blue line), and randomly selected autosomal variants (gray line). Shading represents SE.

