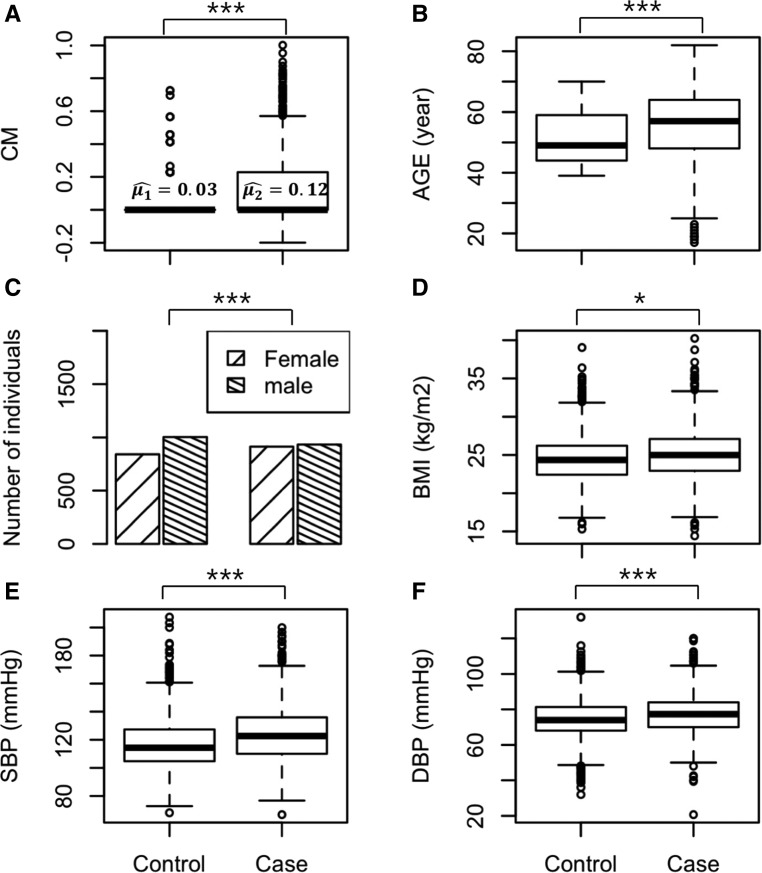
Figure 2.
Clinical variables between cases and controls. Conditional mean (CM) (A), age (B), sex (C), body mass index (BMI) (D), systolic blood pressure (SBP) (E), and diastolic blood pressure (DBP) (F) are shown in boxplots. Two-sample t-test was performed to obtain P-values (* < 0.05; *** < 0.001). For sex, a χ2 test was conducted.

